
Is dbt the Future of Analytics?
How this tool is changing the way data analysts work

If you’ve heard of an analytics engineer or know about data modeling, then you’re probably familiar with dbt (if you aren’t familiar, read what it is here). It is quite the hot tool right now because it makes the data team’s life easier! And isn’t that what we all want in a tool?
I was first introduced to dbt two years ago while working as a data engineer. I had no idea what it was or how to properly use it. I read up on lots of documentation, and honestly, was still pretty confused. It wasn’t until I put the tool into action that I really saw its value.
Since I was on an engineering team, we actually weren’t focused on analytics at all. It was an engineering team supporting the finance side of our business. We used dbt to compile and test our SQL code, making it much quicker to run than on the internal platform we were expected to use.
So, while I’ve been using dbt for years, I never used it for analytics purposes until my most recent role. We chose to implement it into a data stack consisting of other new tools such as Fivetran, Snowflake, and Prefect.
Using these tools together in a new data stack, our data culture has already begun to transform. We have already seen immense improvements in the quality of our data, the speed at which the models run, and the documentation around its use. Dbt is here to stay for the analytics long-haul and here’s why.
Data Quality
The best part about dbt is that it eliminates the need to rewrite the same code over and over again. You can write a model once and then reference it within your other models. This creates more dependable code because you’re using the same logic in all your models.
One of the ways this comes in handy with analytics is through your company’s key performance indicators. We have one way of defining this and calculating this. Oftentimes, if this KPI is being calculated differently in many different models, there’s room for a lot of things to go wrong.
Dbt helps by making our code modular. We can simply reuse rather than recode! Not only does this increase data quality, but it also saves us analysts a lot of precious time.
Another way dbt increases data quality is by encouraging casting and renaming directly at the source. You can read more about this in their documentation here. But, essentially, you do all of the smaller data “housekeeping” tasks in your base models. These are the models that select directly from the raw source tables.
Then, your other models only reference these base models rather than any of the raw data. This prevents errors like accidentally casting your dates to two different types of timestamps (yes, that’s happened to me before), or giving the same column two different names.
These types of issues are simple but probably some of the hardest to figure out when you’re deep into writing a data model. The two different timestamp castings caused all of the dates to be improperly joined in the downstream, turning the model into a huge disaster. Luckily we were able to discover this and fix it before going to production.
Speed
If you’re using another transformation tool other than dbt then you probably understand the need for speed. I’ve seen data models that take over 8 hours to run! I’m sorry but you cannot have an efficient analytics workstream if your data models are taking that long to run.
Dbt enables you to organize your code into base and intermediary data models that make running your core data models a whole lot faster. Because your models are also modular, you run them once and reference them in your other models. You aren’t wasting time and resources running the same blocks of code over and over again.
Dbt models are also run in parallel when being executed using the dbt run command. Models that have dependencies aren’t run until their upstream models are completed but models that don’t depend on one another are run at the same time. This increases throughput and minimizes run time.
Models are run in parallel by using a technique called “multithreading”. Different models are processed on different threads, allowing them to be executed together. When you see thread: 300 in your dbt_project.yml file, that’s just referring to how many models you’re allowing to run simultaneously.
Documentation
Documentation is one of the most underrated differentiators in the world of analytics and data modeling. Your data is only as useful as how well it is documented. Not only does it make successfully onboarding new team members three times as fast, but it gives everyone on the team a deeper understanding of the data.
If you’re doing analytics right, you’re constantly asking questions about your data. When questions are asked, dbt documentation can be there to provide the answers. Even people who have been at the company for years are going to have to reference data definitions every once in a while. You can never have TOO MUCH data on data. Us data nerds love some good metadata.
Dbt allows you to add descriptions of your models right into the code itself. It makes it easy to keep track of column names and descriptions as well. This documentation is written in a .yml corresponding to the directory in which your model is stored.
These .yml files can then be used to generate a website around all of your dbt documentation. Dbt makes this extremely easy by providing its users with the dbt docs command. All you have to do is run the following on the command line:
dbt docs generatedbt docs serve
After running these two commands, a local website will be populated for you to view. Typically you just navigate to localhost:8080 and can see your documentation in an easy-to-read format.
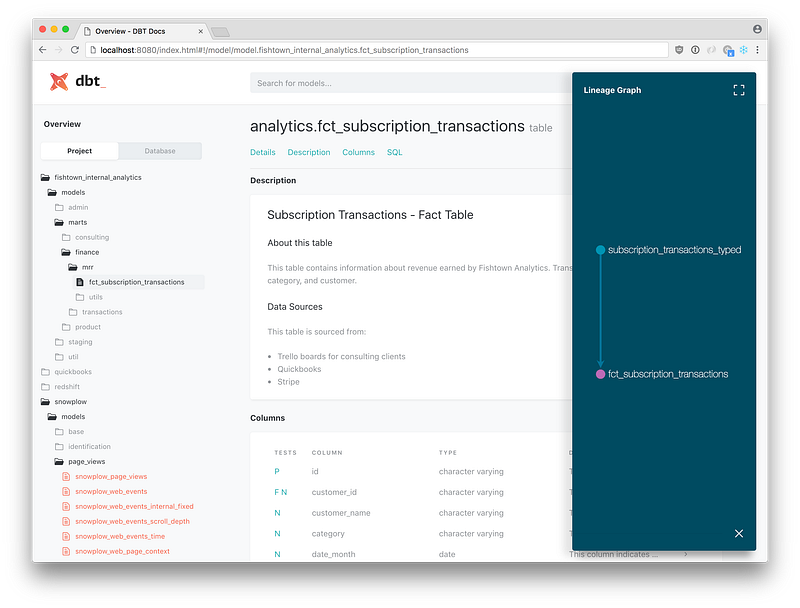
This is an example of what the website looks like. You can see your projects and databases on the left, organized similarly to how you would see them in your code environment. When you click on a model you are able to read the description and see information on the columns in that model.
My favorite feature of the dbt documentation is probably the lineage graph (also known as a DAG). This is similar to what you would see on an orchestration website. It gives a great visual of which models depend on one another. You can easily see which base and intermediary models all of your core models use by looking here.
If you want to use this documentation within your company, I recommend hosting this website on an internal company website or using a solution like Netlify. You pay $19 per user per month and have a great source of truth for all of your data models.
Conclusion
Dbt is helping companies take the next step in becoming a data-driven culture. It is transforming the idea of the modern data stack, blowing all the other transformation tools out of the water. Dbt will continue to be a large part of how companies are increasing the quality, speed, and documentation around their data.
Dbt isn’t going anywhere soon. It is a tool that is here to stay. I highly recommend learning it and embracing it into your team’s data culture. The sooner your start incorporating it, the more you can learn from it and allow it to make incredible changes to how you use your data.
Learn more about dbt and other popular modern data stack tools by subscribing to my email list.