
Investing With the Sharpe Ratio
The Sharpe ratio, named after William F. Sharpe, is an analysis ratio that provides us insight into how much risk we are about to self inflict on an investment when compared to its potential reward.
What is the Sharpe Ratio?
The Sharpe ratio measures the reward-to-variability ratio of an investment by dividing the average risk-adjusted return by volatility. Investors can directly compare multiple investments and evaluate the amount of risk that each investment took on per percentage point of return. This ratio allows investors to better manage their risk exposure while maximizing potential returns. Relatively speaking, mo money mo problems.

Why the Sharpe Ratio?
When creating a fund, the first and most obvious problem that fund managers run into is “How do I properly allocate my money in order to maximize my potential returns, while being able to sleep at night knowing that my fund won’t crash and burn at any second?”
How Can I Calculate It?
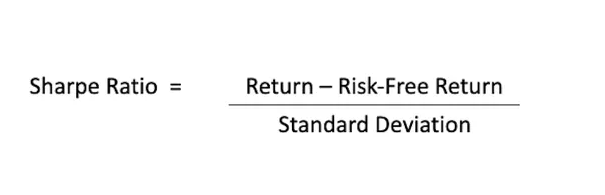
It’s Easy! In order to calculate the Sharpe Ratio for your investment, you first begin by subtracting the risk-free rate of the return from the expected rate of return from the investment. You then divide that number by the standard deviation of that investment’s annual rate-which is a measurement of volatility.
Standard deviation: In statistics, the standard deviation is a measure of the amount of variation or dispersion of a set of values. A low standard deviation indicates that the values tend to be close to the mean of the set, while a high standard deviation indicates that the values are spread out over a wider range.
Volatility: The degree of variation of a trading price series over time, usually measured by the standard deviation of logarithmic returns. Historic volatility measures a time series of past market prices.
Why Does the Sharpe Ratio Work?
In order to fully understand why the Sharpe Ratio works, it is important to refresh our knowledge on risk-adjusted returns.
Risk-adjusted returns: is a risk-based profitability measurement framework for analyzing risk-adjusted financial performance and providing a consistent view of profitability across businesses. The concept was developed by Bankers Trust and principal designer Dan Borge in the late 1970s.
The easiest way to measure risk is by using the beta coefficient, which measures a fund’s volatility against a benchmark. This can be used as taking the volatility from your fund of all altcoins and using Bitcoin as your benchmark.
A fund’s beta is simply a measure of how volatile an investor can expect the fund to be compared to the overall market. A beta of more than one means that the fund is more volatile than the overall market, and a beta of less than one means that it is less volatile.
We can use this method to evaluate excess returns. It shows us whether these originated from a smart investment strategy, or there was too much risk involved. An asset can have a higher yield, but that’s only worth it if it doesn’t bring excessive amounts of additional risk.
An investment can have a negative ratio, showing the asset is underperforming against the benchmark. However, this gives us no real insights, as it means that either the risk-free rate is above the investment return, or the return is negative.
Using the Sharpe Ratio
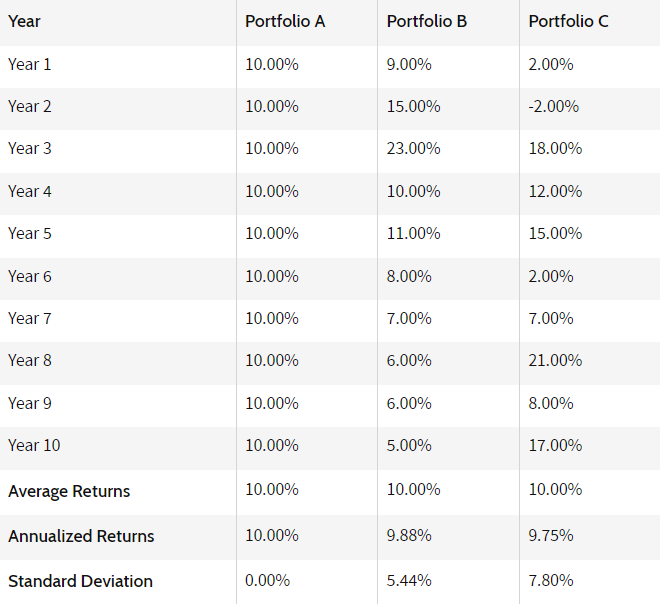
An investor has a choice of three portfolios, all with expected returns of 10 percent over the next 10 years. The average returns in the table (below) indicate the stated expectation. The returns achieved for the investment horizon is indicated by annualized returns, which takes compounding into account. The standard deviation takes returns away from the expected return. If there is no risk — zero standard deviation — your returns will equal your expected returns.
Now let’s think about this, what if Fund Manager A generates a return of 15%, and Fund Manager B generates a return of 12%. It appears that Fund Manager A is a better performer. However, if Fund Manager A took larger risks than Fund Manager B, it may be that Fund Manager B has a better risk-adjusted return.
In addition to this example, say that the risk-free rate is 5%, and Fund Manager A’s portfolio has a standard deviation of 8% while Fund Manager B’s portfolio has a standard deviation of 5%. The Sharpe ratio for Fund Manager A would be 1.25, while Fund Manager B’s ratio would be 1.4, which is better than that of Fund Manager A. Based on these calculations, Fund Manager B was able to generate a higher return on a risk-adjusted basis.
For some insight, a ratio of 1 or better is good, 2 or better is really good, and 3 or better is extremely good.
Limitations of the Sharpe Ratio
While the Sharpe ratio makes for an equitable comparison between similar investment products, you should keep in mind that investments with a higher Sharpe ratio can be more volatile than those with a lower ratio. The higher Sharpe ratio simply indicates that the investment’s risk-to-reward profile is more optimal or proportional than another. There could still be significant risks or volatility involved.
Conclusion
When we evaluate investment opportunities, we must consider both reward and risk at the same time. The Sharpe Ratio allows us to determine the asset with the best return, while also taking risk into account.
Now that you have a rough understanding of what the Sharpe Ratio is and why we use it, go out there and reinforce your knowledge by implementing it into your next fund.
Useful Links
Notes on Sharpe Ratio- https://cran.r-project.org/web/packages/SharpeR/vignettes/SharpeRatio.pdf
Sharpe Ratio: Estimation, Confidence Intervals, and Hypothesis Testing- https://www.twosigma.com/wp-content/uploads/sharpe-tr-1.pdf
The Statistics of Sharpe Ratios- https://alo.mit.edu/wp-content/uploads/2017/06/The-Statistics-of-Sharpe-Ratios.pdf


