
Intuitively, How Can We (Better) Understand Logistic Regression
Logistic Regression and Linear Discriminant Analysis are closely related. Here is an intuitive way to understand them and to help us define Softmax Regression
In my previous article, I introduced 5 principles of classification that helped us to define more than 5 types of algorithms.
The intuition that we used for logistic regression was to “smooth the straight line”. The smoothing function is a logistic function. Now how can we better understand how we come up with this logistic function ?
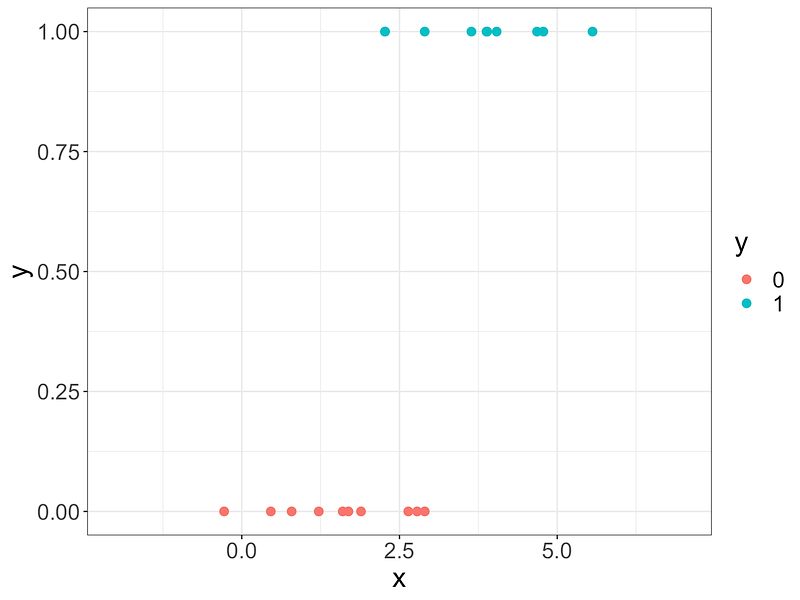
As in the previous article, we will explain the principle for the 1D situation, with blue dots and red dots.
How LDA and Logistic Regression are related
In order to explain LDA (Linear Discriminant Analysis), the idea is to first build two normal distributions. For a new dot x, we can consider:
- PDF_b(x) with PDF_b: Probability Density Function of blue dots, and
- PDF_r(x) with PDF_r: Probability Density Function of red dots
- p(B): the proportion of blue dots
- p(R):the proportion of red dots
The final probability of the new dot being blue is:
p(B)×PDF_b(x)/(p(B)×PDF_b(x)+p(R)×PDF_r(x))
Now let’s look at the normal PDF:
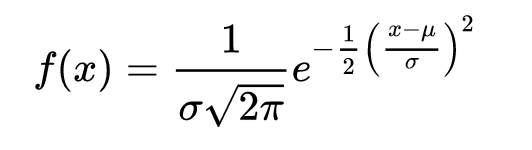
Since we consider that in the case of LDA, standard deviation is the same for the two classes, then we can simplify and the x² term will go away, which is why we call this Linear Discriminant Analysis.
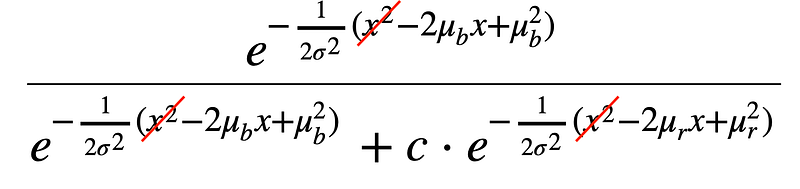
If we don’t adopt the hypothesis of homoscedasticity (which means same standard deviation for the two classes), the x² term will remain and the algorithm is then called Quadratic Discriminant Analysis.
So for LDA, we end up with something like:
1/(1+exp(ax+b))
Yes, a logistic function !
Of course, the parameters a and b are different from the actual logistic regression.
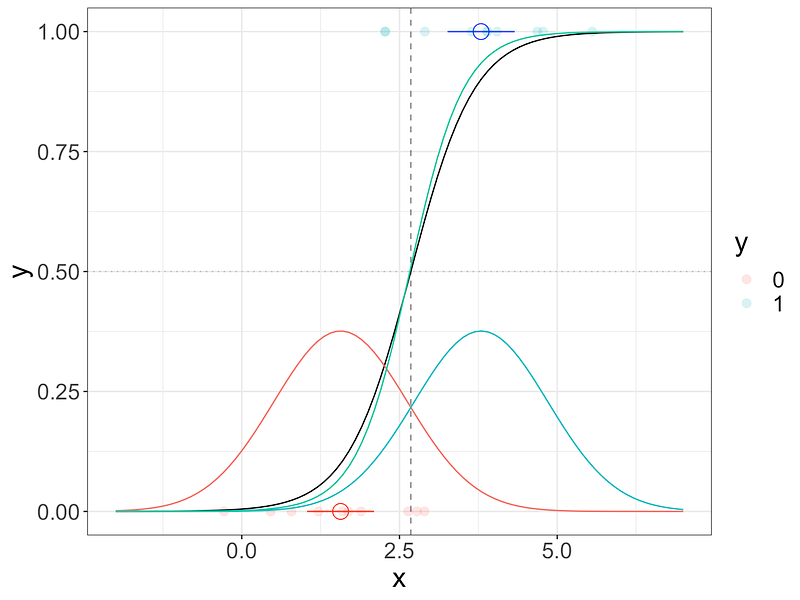
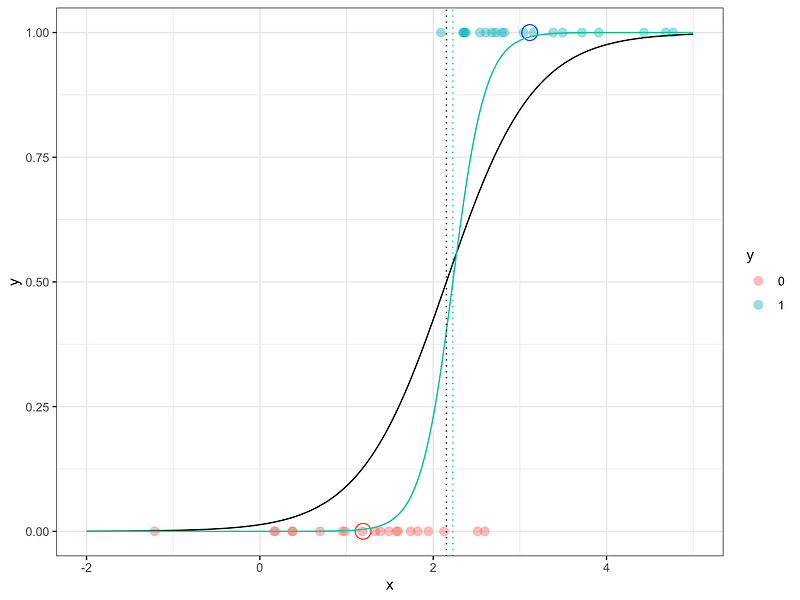
We can compare the results, and in this situation, we can see that the results are actually very close (the green curve being logistic regression and the black curve being LDA).
Conclusion: LDA and Logistic Regression produce the final probability which is a logistic function. The only difference between the two approaches lies in the fact that
- Logistic Regression uses maximum likelihood to estimate the parameters
- LDA, the parameters come from the estimated mean and variance from a normal distribution and the proportions of each class (prior probability)
Simplify the Normal PDF
Since we know that the x² in the normal PDF will go away in the hypothesis of homoscedasticity , maybe we can directly get rid of it at the beginning.
So we can directly consider:
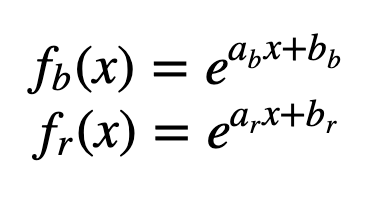
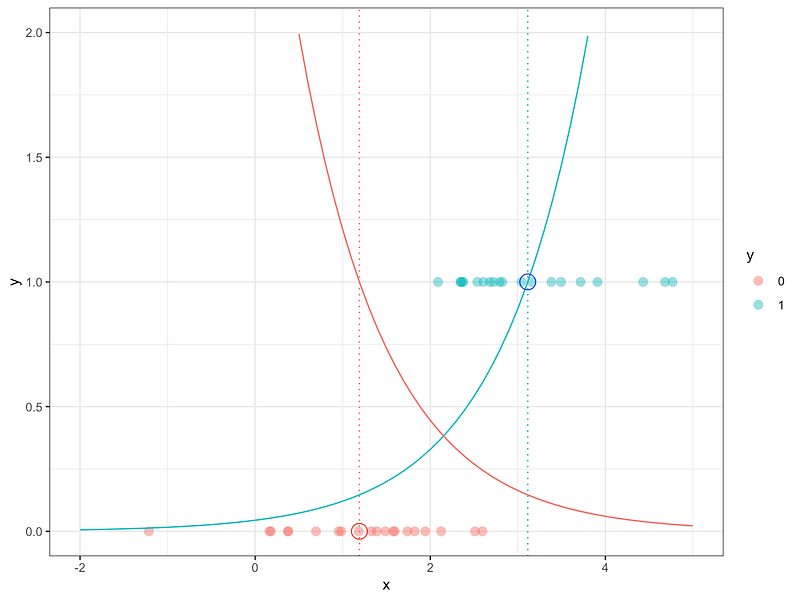
We can test some parameters, in order to draw the curves. Let’s begin with the blue curve fb(x):
- to begin with, we can let a_b=1 (the parameter a for blue dots)
- for b_b, we can say that the curve should pass the point (x=mean of blue dots, y=1)
And we consider that the situation is symmetric for the red curve:
- a_r =-1
- and the red curve should pass the point (x=mean of red dots, y=1)
Computation of the ratios
When we calculate the ratio to get the final probability
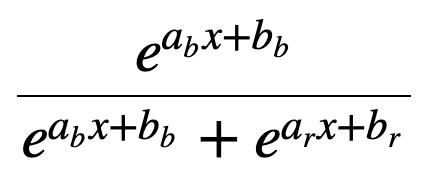
We also end up with a logistic function.
Below we can see the ratio (black line). Remember that the parameters a and b here are chosen manually.
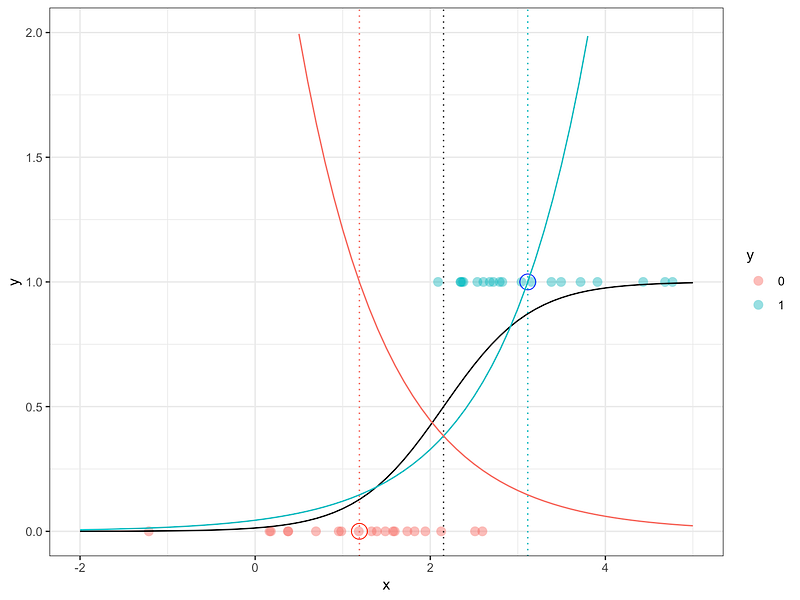
But even though, we can see that it is actually not that bad in the given situation. The green line in the graph below is the logistic regression model while the black line is the ratio calculated with our manually chosen parameters.
Conclusion: logistic regression is a normalized exponential function (defined by the two classes).
Softmax regression
With the intuition of “smoothing the straight line”, it is not easy to generalize for the situation of multiple prediction classes. But with the idea of normalized exponential function, we can add more classes.
For K classes, we can consider this normalized exponential function to estimate the probability of x to belong to class j
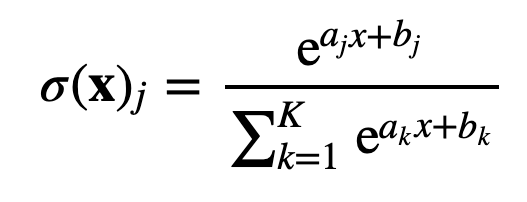
Here is a graph with 3 classes
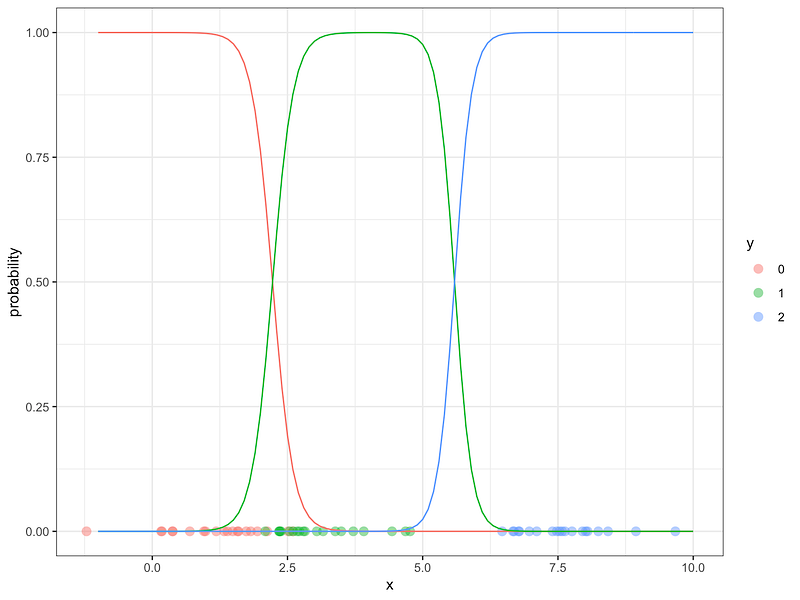
This is called softmax regression and now you know that behind this fancy name, it is just a very simple generalization of logistic regression.
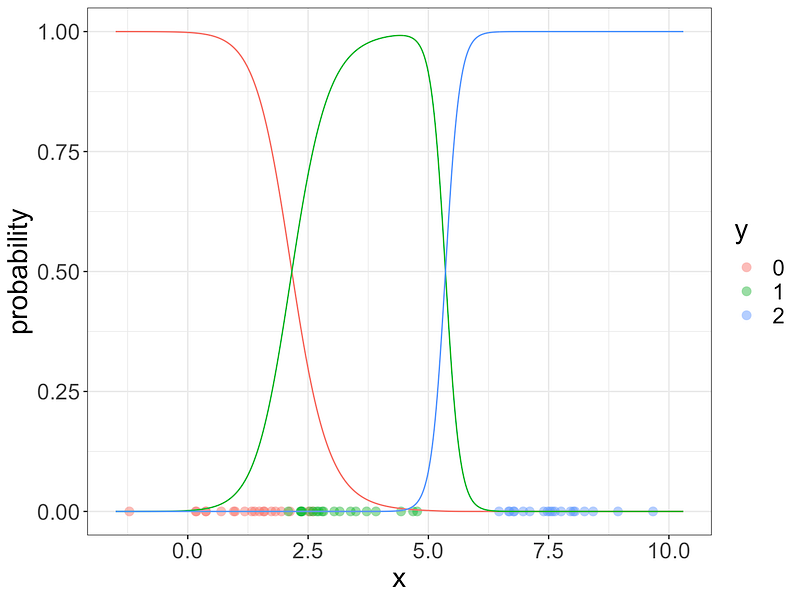
Since you know that logistic regression is very close to LDA, then the result of softmax regression should be close to multiclass LDA as is the case in the graph below:
If you find something not intuitive enough or if you have any question, please comment, this will help me improve my writing.


