
Introduction to Prometheus PromQL. Local setup included
Prometheus is a powerful tool used for collecting metrics from a variety of devices. PromQL is a query language used to fetch necessary data used to analyze and for a graphical representation using tools such as Grafana.

Data
Prometheus stores data as a time series. Each entry in Prometheus consists of a metric name, a set of labels, a UNIX timestamp, and a sample collected at that timestamp.
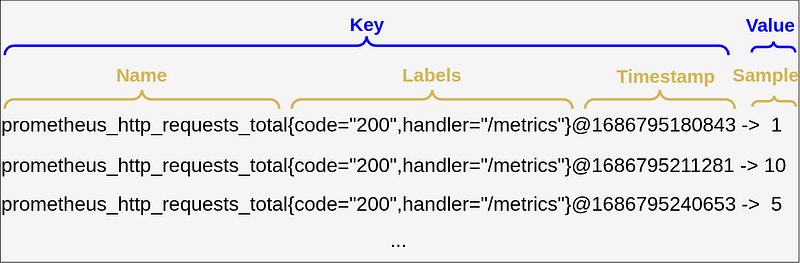
In the example above, we have a metric that reflects the total of HTTP requests performed to a particular endpoint and is called:
prometheus_http_requests_total
This metric has a list of labels, one indicates an HTTP response code, and another the endpoint (handler). The time stamp indicates that this metric was sampled every 30 seconds.
Metrics type
Now we have to understand how Prometheus collects the data. From the Prometheus server perspective, there are no different types of metrics and the server used all data as untyped time series. At least at the moment, remember that this can change in the feature.
The differentiation exists only in client libraries used to gather metrics. So the client libraries have 4 types of metrics.
Counters as the name suggests it is used to count some events. This type should be used for a metric that only goes up or can be reset to a zero value. For example, request counts of some endpoint, messages sent to a queue or topic, etc.
A gauge is similar to a counter, as it is a single numeric value but it can go up and down. This type is used to represent the usage of computer resources, for example, the percentage of memory, or percentage of CPU used at any given time. It can be used to represent a number of container instances or a number of threads at a particular timeframe. In this case, it can go up and down.
Histogram sample observations usually duration of some event, such as HTTP request and response. It samples them by their frequency or count, putting the gathered values in pre-defined buckets. The Prometheus client library uses a set of default buckets (e.g. for the Go client library, it uses .005, .01, .025, .05, .1, .25, .5, 1, 2.5, 5, 10). If custom values for buckets are required it can be overridden. Buckets are used to track the distribution of an attribute over a number of events.
A histogram samples observations (usually things like request durations or response sizes) and counts them in configurable buckets. It also provides a sum of all observed values.
The summary works similarly to the histogram, but on top, it provides some additional parameters. Such as a total count of observations and a sum of all observed values. And it calculates configurable quantiles over a sliding time window.
PromQL data types
Prometheus Query Language (PromQL) is a query language used to select and aggregate data stored in Prometheus, in real-time.
When querying data by PromQL the Prometheus will represent data in 4 different formats: String, Scalar, Instant, and Range vectors.
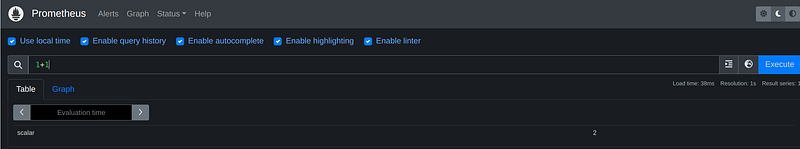
The String type represents text and is currently unused. The Scalar type represents numerical values.
The vector in Prometheu's perspective is a set of related time series. And you remember that Prometheus stores all its data as a time series.
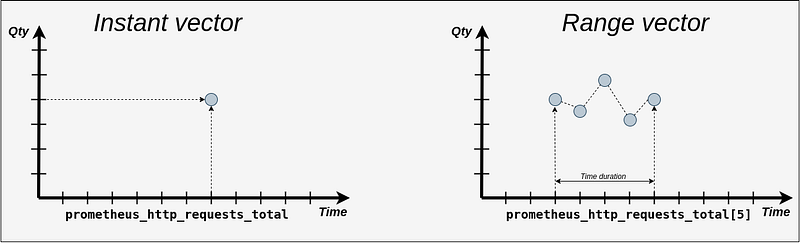
The instant vector represents a set of time series where every timestamp maps to a single data point at that “instant”.
The range vector doesn’t represent only one value, like the instant vector, it represents a set of values measured between two timestamps. The square brackets are used to specify a time range (duration).
Run Prometheus locally
The easiest way to learn how PromQL works is to create a Prometheus instance on the local machine using Docker and Docker Compose.

The docker-compose file is below:
version: "3.8"
services:
prometheus:
container_name: prometheus
image: prom/prometheus:v2.44.0
user: root
volumes:
- ./prometheus:/etc/prometheus
command:
- --config.file=/etc/prometheus/prometheus-config.yaml
- --log.level=debug
ports:
- "9090:9090"
networks:
- prometheus-network
networks:
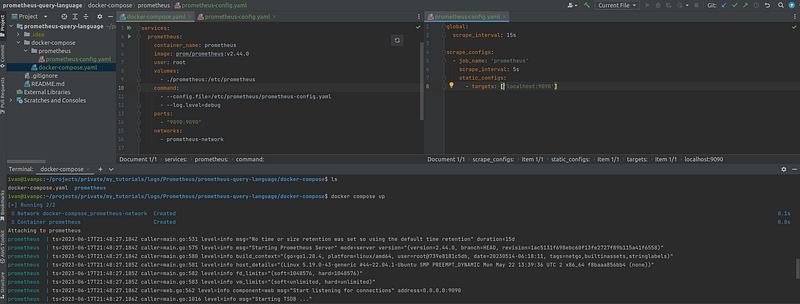
prometheus-network:This file defines one container based on the Prometheus Docker image with version 2.44. This container has one volume mapped that contains a Prometheus configuration file. The configuration file is below:
global:
  scrape_interval: 15s

scrape_configs:
  - job_name: 'prometheus'
    scrape_interval: 5s
    static_configs:
      - targets: ['localhost:9090']
This file defines the scrape config. Based on it Prometheus will collect its own metrics. Using these metrics we can perform a variety of queries.
To create a container run the following command from the directory where the docker-compose file is located:
docker compose up
Now the Prometheus UI can be accessed using the browser on the address:
http://localhost:9090
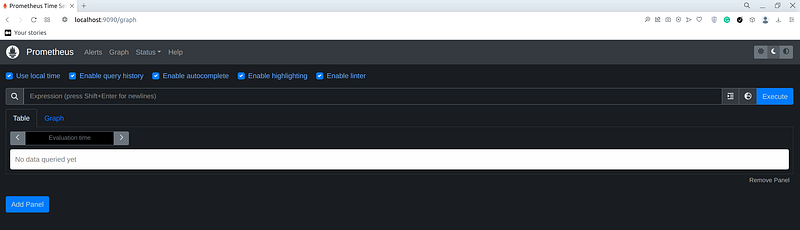
Timeseries selectors
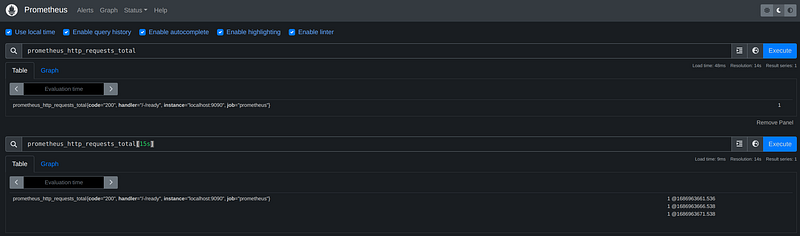
To select a specific instant vector the easiest way is to type its name in the prompt:
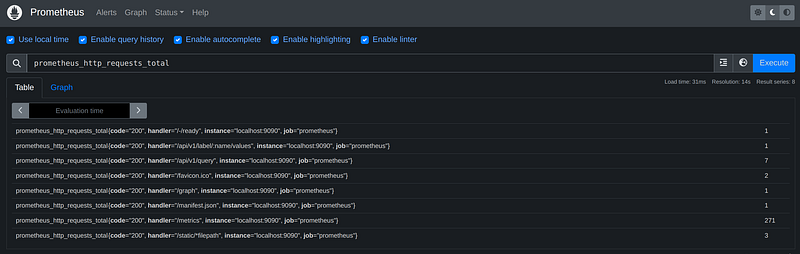
As you can see this query returned more than one result. To select the required information we can use label selectors. These selectors go in curly braces appended after the name of the metric.
prometheus_http_requests_total{l1=v1,ln=vn}For example, if the requirement is to select a metric with the label “handler” equal to “/metrics” we use the following syntax:
prometheus_http_requests_total{handler="/metrics"}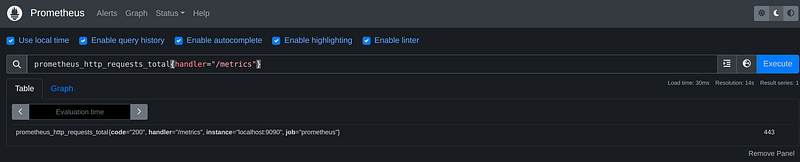
The following operators can be applied to label selectors:
                   | Operator | Meaning              |
                   | -------- | -------------------- |
                   | =        | equals               |
                   | !=       | not equals           |
                   | =~       | regex matches        |
                   | !~       | regex does not match |
When we need to select all metrics but one collected from the metrics handler we use the following query:
prometheus_http_requests_total{handler!="/metrics"}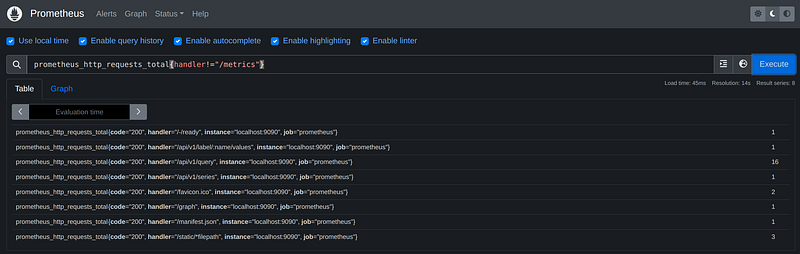
We can select metrics by multiple labels separated by the coma. Consider such a query as a query with an AND operator:
prometheus_http_requests_total{handler!="/metrics"}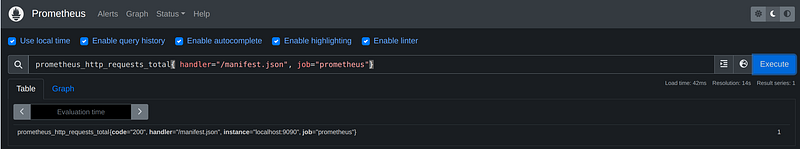
A very useful operator is a regex operator, it allows to create of flexible queries like the below:
prometheus_http_requests_total{handler=~"/metrics|/graph"}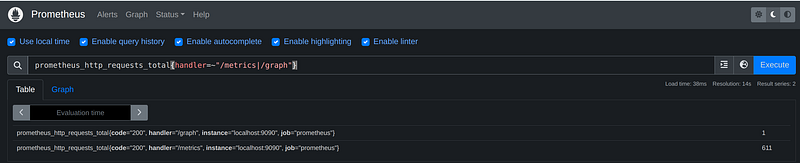
This query uses a pipe (|), and it behaves as an OR operator.
The wild card can be used in regex expressions like so:
prometheus_http_requests_total{handler=~".*v1.*"}This query selects metrics containing “v1” inside the label handler. The wild card “.*” can be applied in front and at the back of the value or both.
All the above queries apply to range vectors, the only additional thing we have to add is duration, which goes into square brackets. In brackets, we specify a number followed by the time unit.
                   | Unit     | Meaning       |
                   | -------- | --------------|
                   | ms       | milliseconds  |
                   | s        | seconds       |
                   | m        | minutes       |
                   | h        | hours         |
                   | d        | days (24h)    |
                   | w        | weeks (7d)    |
                   | y        | years (365d)  |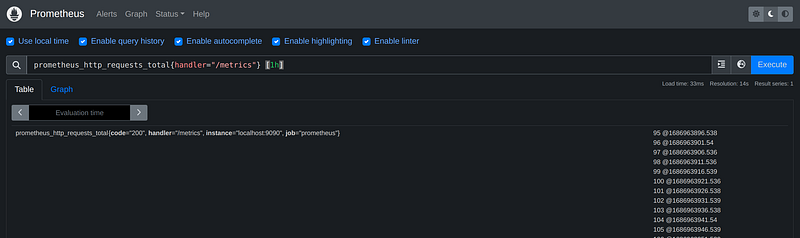
Time units can be combined like so:
prometheus_http_requests_total{handler="/metrics"} [1m30s]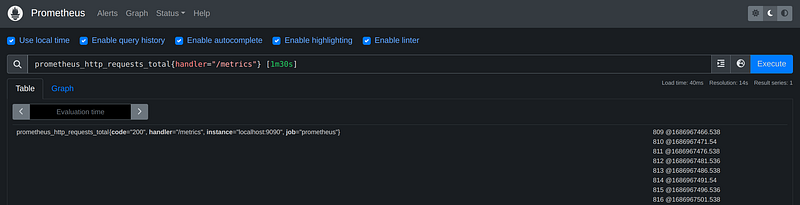
Offset modifier
The offset modifier is used to shift the time offset for individual instant and range vectors in a query.
prometheus_http_requests_total{handler="/metrics"} offset 10mThis query returns a sample that was taken 10 minutes in the past relative to the current time.
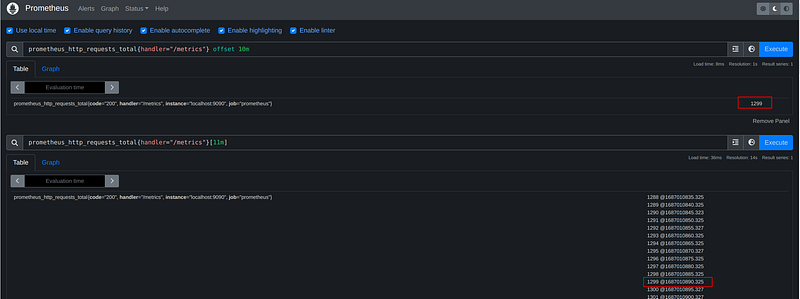
The query returned a result that was collected 10 minutes ago. To better understand how it works below I executed a query that returned a range vector with a range of 11 minutes. When we get the timestamp and convert it to date time it will be a date and time exactly 10 min ago.
In the same way, the offset can be applied to a range vector:
prometheus_http_requests_total{handler="/metrics"}[1m] offset 10m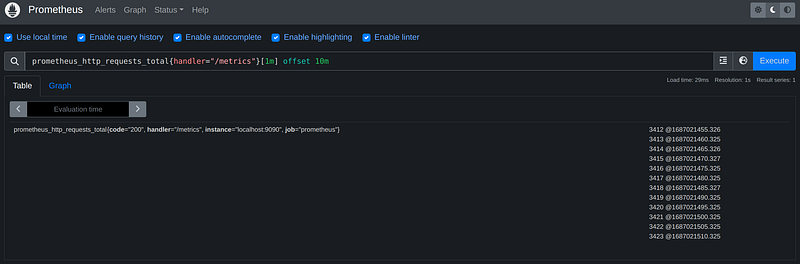
Binary arithmetic operators
The following binary operators can be applied in PromQL with scalar and instant vectors
                   | Operator | Meaning       |
                   | -------- | --------------|
                   | +        | addition      |
                   | -        | substraction  |
                   | *        | multiplication|
                   | /        | division      |
                   | %        | modulo        |
                   | ^        | power         |
Used with scalar values it will result in a scalar value.
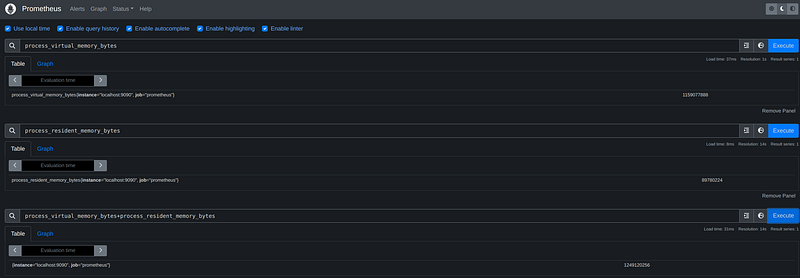
When applied with a scalar value and instant vector the scalar value is applied to each element of an instant vector
prometheus_http_requests_total{handler=~".*v1.*"}+1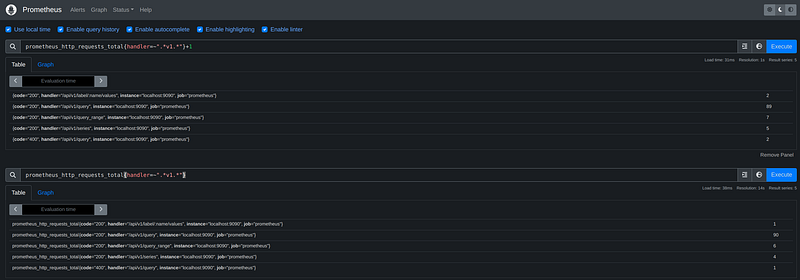
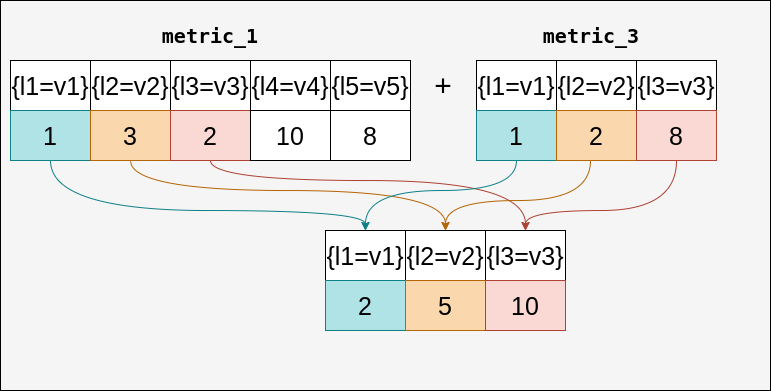
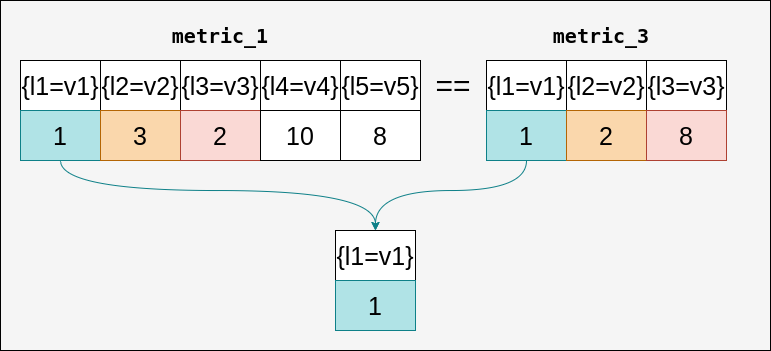
When we apply a binary operator with instant vectors the result is going to be a new vector containing elements that are present in both vectors.
Comparison operators
The following comparison operators can be applied
| Operator | Meaning |
| -------- | --------------------|
| == | equals |
| != | not equals |
| > | grater-than |
| <= | less-than |
| >= | grater-than or equal|
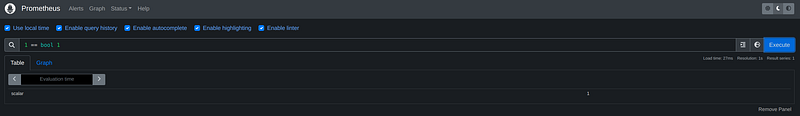
| <= | less-than or equal |Applied to the scalar value will give a boolean value (0-false, 1-true). When using those operators with scalars we have to add a special “bool” modifier.
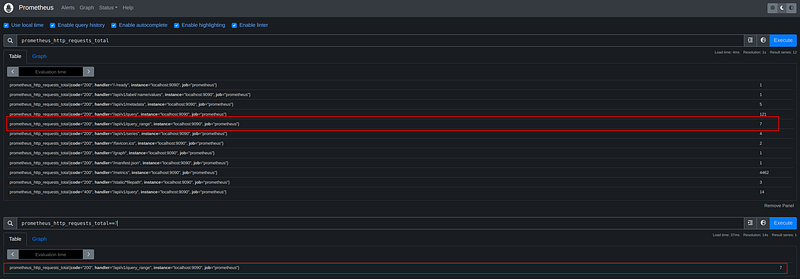
When the operator is used with scalar and instant vectors the result of the query will be a new vector with only values that are matching to the applied operator.
prometheus_http_requests_total==7
When we apply a comparison operator with instant vectors the result is going to be a new vector containing elements that are present in both vectors.
Set binary operators
Can only be applied to Instant Vectors:
| Operator|                     Meaning                                       |
| --------| ------------------------------------------------------------------|
| and     | new vector with element that matches in both                      |
| or      | new vector which is the union of all unique elements              |
| unless  | new vector which elements which are not present on the left side  |
When running the following query no result will be found, because there are no matching elements in both vectors
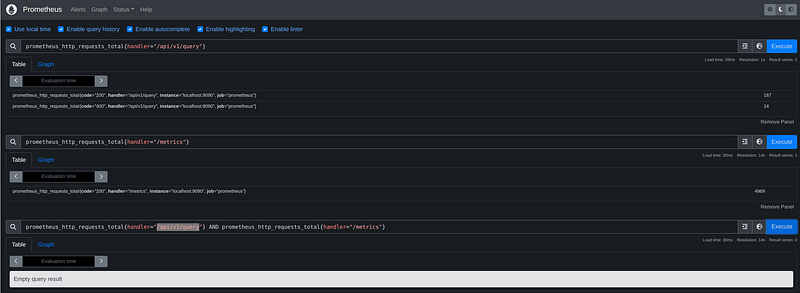
prometheus_http_requests_total{handler="/api/v1/query"} AND prometheus_http_requests_total{handler="/metrics"}When using the OR operator the result will be as follow
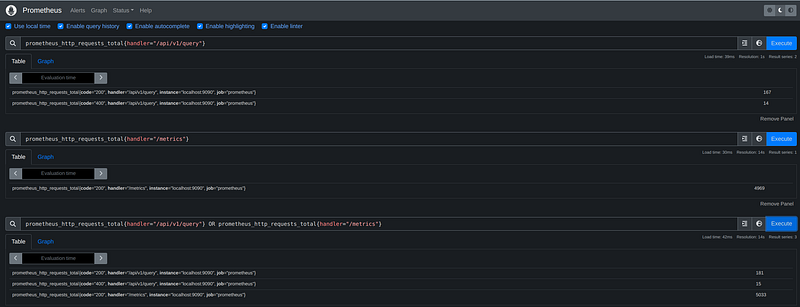
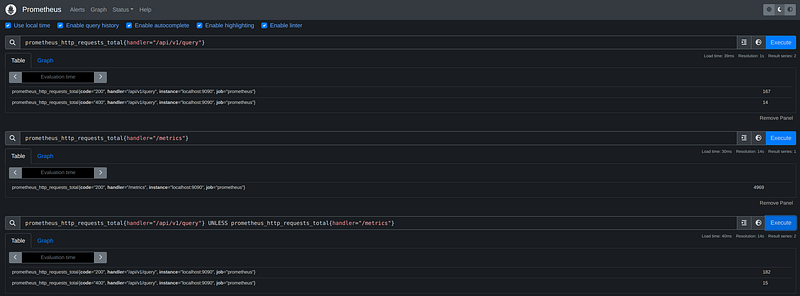
This query returns all elements present in both vectors. And the query with the Unless operator returns elements from the left side vector that are not present in the right side vector.
Aggregation operators
Prometheus has a wide variety o aggregation operators that can be applied to instant vectors. The sum aggregator calculates the sum of all elements in the vector.
sum(prometheus_http_requests_total)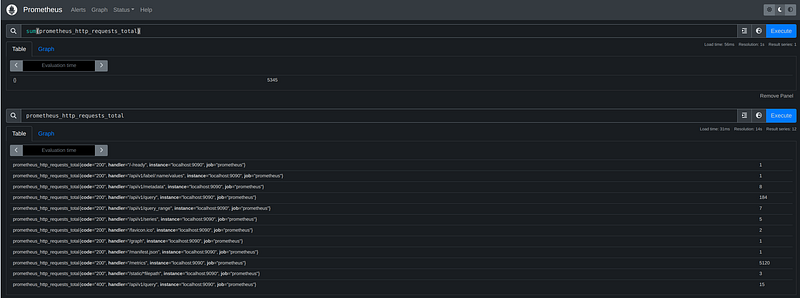
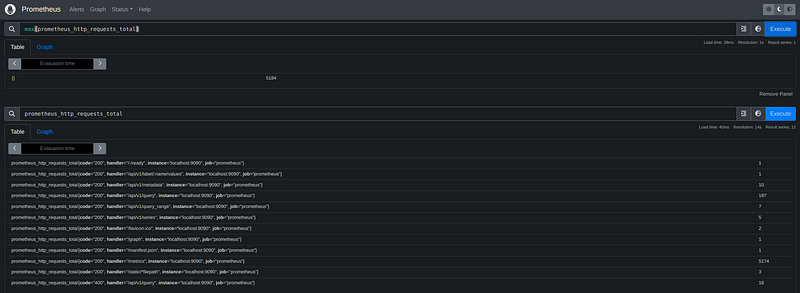
Min and max aggregators calculate the lowest and highest value in the vector:
min(prometheus_http_requests_total)

max(prometheus_http_requests_total)
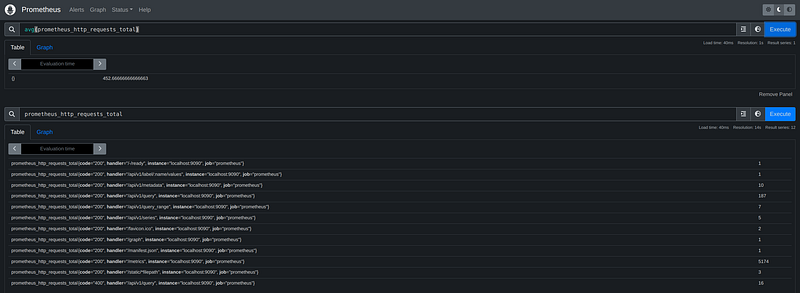
The avg calculates the average of the vector:
avg(prometheus_http_requests_total)
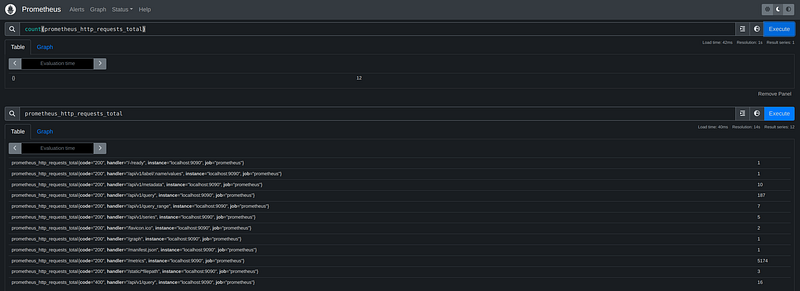
The count aggregator returns the number of elements in the vector
count(prometheus_http_requests_total)
The aggregator count_values counts a number of elements in the vector with the same value.
count_values ("prometheus_http_requests_total", prometheus_http_requests_total)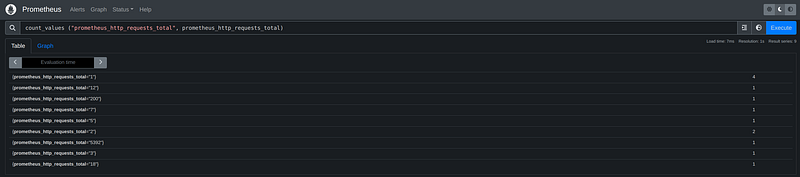
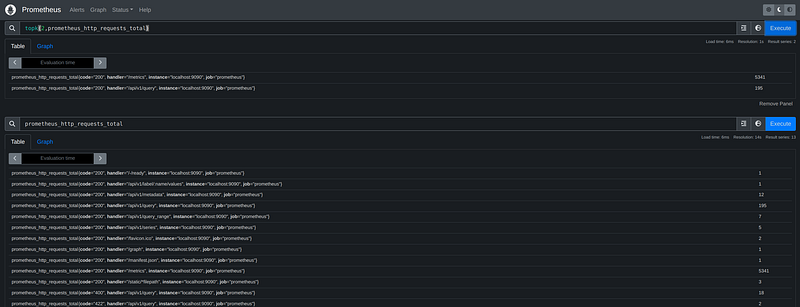
The aggregator tork returns n largest values from the vector:
topk(2,prometheus_http_requests_total)
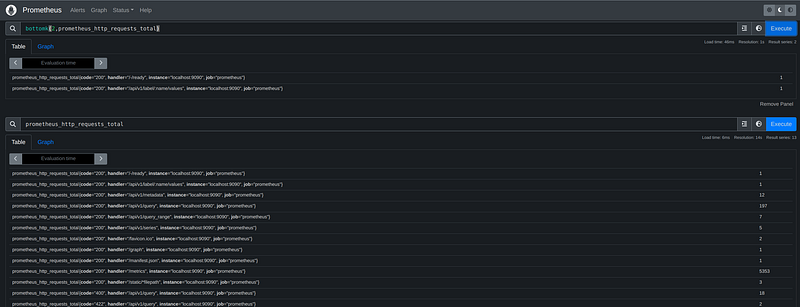
And the bottomk works in the opposite way
bottomk(2,prometheus_http_requests_total)
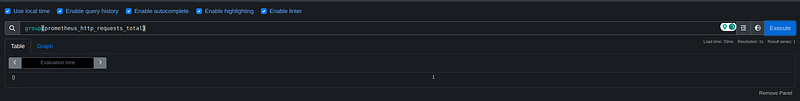
The operator group does what its name says groups elements and returns 1
group(prometheus_http_requests_total)
We can aggregate a vector by specific labels, like so by appending a “by” modifier.
sum(prometheus_http_requests_total) by (code)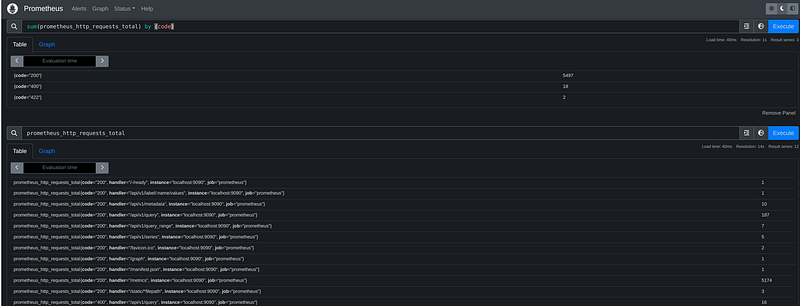
If we want to exclude some labels we can add a special modifier “without”:
sum(prometheus_http_requests_total) without (code)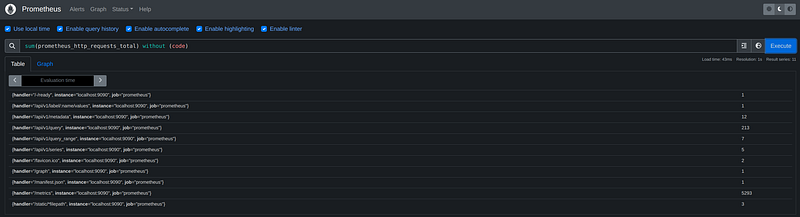
We can use aggregators over time for range vectors such as
avg_over_time(prometheus_http_requests_total[10s])
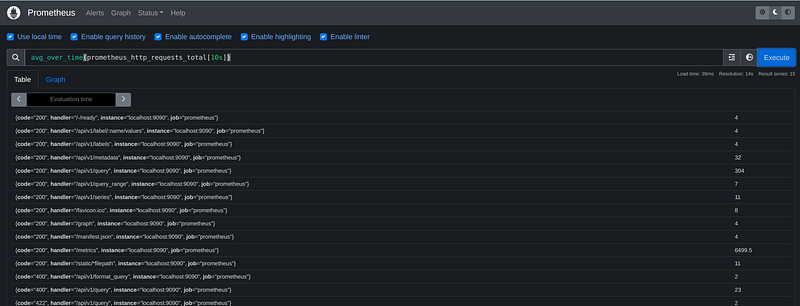
This aggregator calculates the average in the vector in a specified range.
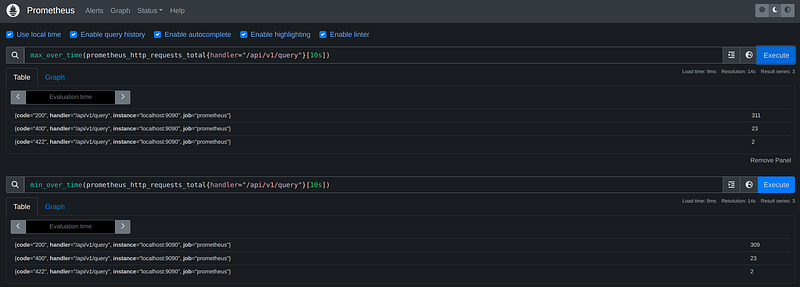
Prometheus has plenty of aggregators that can be applied to range vectors. They are sum_over_time, min_over_time, max_over_time, count_over_time, and many more.
Functions
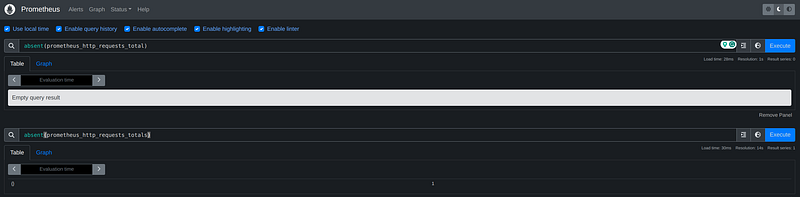
Prometheus offers us a wide variety of functions. The first function that we going to check is absent. This function checks if an instant vector has any elements. Returns an empty vector when a vector passed to this function contains elements and returns 1 when a vector doesn't have values.
absent(prometheus_http_requests_total)
If we need to get the same result but for a range vector, we have to use the following function:
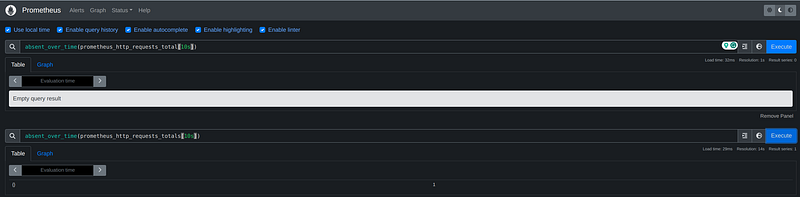
Prometheus has mathematic functions such as abs, ceil, and floor.
The function clamp converts the lowest values to the value specified as a second parameter and converts the largest values specified as a third parameter.
clamp(prometheus_http_requests_total{handler=~"/metrics|/api/v1/labels|/api/v1/format_query"},3,6000)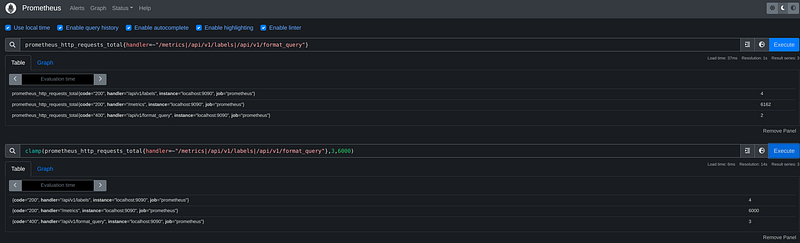
From the screen, we can see that this function converted the highest sample from 6162 to 6000 and the lowest from 2 to 3.
There are 2 more versions of this function clamp_min and clamp_max
clamp_min(prometheus_http_requests_total{handler=~"/metrics|/api/v1/labels|/api/v1/format_query"},3)clamp_max(prometheus_http_requests_total{handler=~"/metrics|/api/v1/labels|/api/v1/format_query"},6000)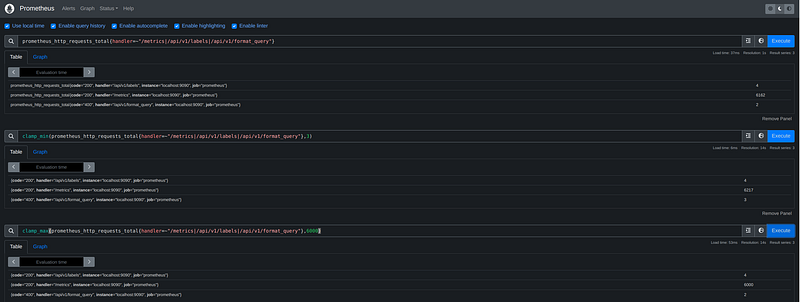
Those functions will make graphics look a bit nicer, by removing extreme spikes.
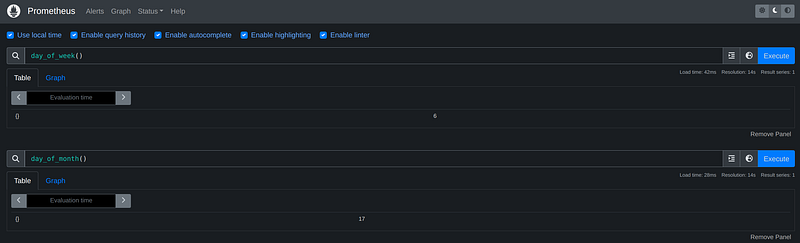
Prometheus has a set of functions to work with date and time, such as day_of_month, day_of_week, and more.
Day of month returns the day of the month (1–31) for every timestamp in a UTC format. And the day of the week returns the day of the week (1–7) for every timestamp in UTC format.
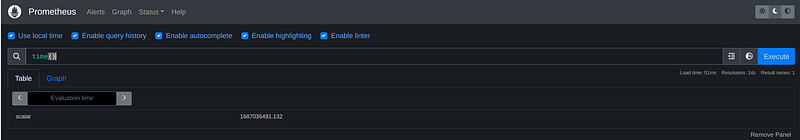
The time function returns near the current timestamp
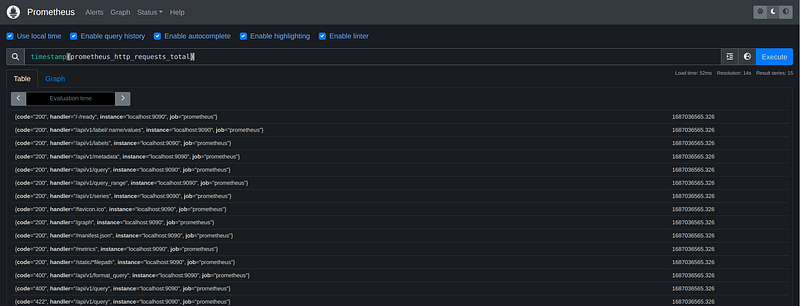
The function timestamp returns the timestamp on which each element of a vector was sampled.
timestamp(prometheus_http_requests_total)
If we need to sort the instant vector we can use sort and sort_desc functions. First sorts the vector in ascending order and the second in descending order.
sort(prometheus_http_requests_total{handler=~"/metrics|/api/v1/labels|/api/v1/format_query"})sort_desc(prometheus_http_requests_total{handler=~"/metrics|/api/v1/labels|/api/v1/format_query"})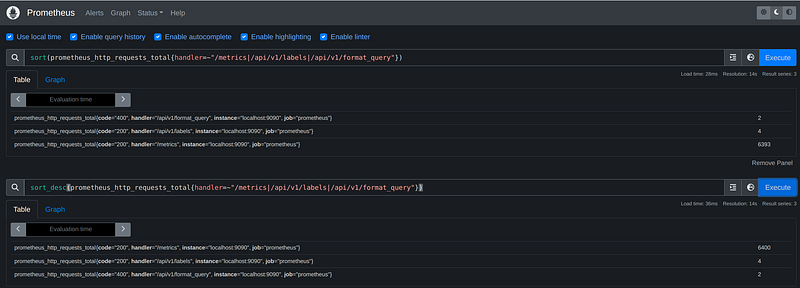
The complete project can be found here:
Conclusion
This tutorial is about PromQL, a tool that can help you extract important information from the metric of your system. It also helps to create a visualization of metrics and define alarms that will alert you about a problem in your system.
Thank you for reading! Please like and follow. If you have any questions or suggestions, please feel free to write in the comments section or on my LinkedIn account.
Become a member for full access to Medium content.
Level Up Coding
Thanks for being a part of our community! Before you go:
- 👏 Clap for the story and follow the author 👉
- 📰 View more content in the Level Up Coding publication
- 💰 Free coding interview course ⇒ View Course
- 🔔 Follow us: Twitter | LinkedIn | Newsletter
🚀👉 Join the Level Up talent collective and find an amazing job