
Introduction to One-Way ANOVA: A Test to Compare the Means between More than Two Groups
The Outcomes of Different Groups Look Different, but are they Statistically Different?

Motivation
A t-test is useful to find out whether there is a significant difference between two groups. However, a t-test cannot be used to compare between three or more independent groups.
For example, if you are a product developer, you might want to know whether the change in the percentage of cotton used in the synthetic fiber will result in an increase in the tensile strength of the fiber.
To find out, you can conduct a completely randomized experiment with five levels of cotton content and replicate the experiment five times representing five trials. The data might look like the following table:
By looking at the table alone, it is difficult to know whether there are statistically significant differences between the means of these 5 levels of cotton content. Since there are more than 2 groups being compared, a t-test cannot be used in this case.
Is there a way that you can determine whether any of these means are statistically different from each other and produces meaningful outputs like below?
Pairs of levels of cotton content that are not statistically different:
- (15, 20)
- (15, 25)
- (15, 30)
- (20, 30)
- (25, 35)
- (30, 35)
Pairs of levels of cotton content that are statistically different:
- (15, 35)
- (20, 25)
- (20, 35)
- (25, 30)
That is when one-way ANOVA comes in handy.
What is One-Way ANOVA?
The one-way ANOVA compares the means of the groups you are interested in and determines whether any of those means are statistically different from each other. A one-way ANOVA has one independent variable while a two-way ANOVA has two independent variables.
Since there is only one independent variable in our problem, which is tensile strength, we will use a one-way ANOVA.
To perform a one-way ANOVA in Python, we will install and use statsmodels package:
pip install statsmodelsCreate Data
We will create data that is shown in the introduction.
Nice! The data is set up. Now we are ready to use the one-way ANOVA test.
Compare the Means Between Different Groups
We start with testing whether the means of some levels of cotton content are statistically different.
- Null hypothesis: There is no difference in means
- Alternate hypothesis: The means are not all equal
Since anova-lm requires one or more fitted linear models, we start with fitting the Ordinary Least Squares (OLS) model to our data then use it as an argument foranova_lm .
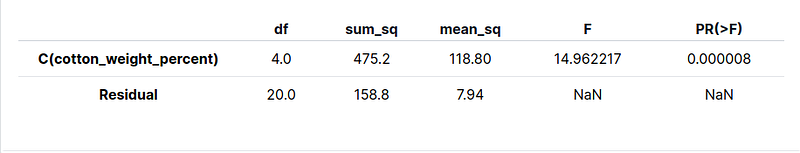
The F-statistic of the model is 14.962217. The p-value of the model is 8e-06.
Since the p-value is less than the significance level of 0.05, there is enough evidence to claim that some of the means of different levels of cotton content are statistically different.
Even though we know some of the means are statistically different overall, which specific two levels of cotton content are different? That is when Tukey’s HSD (Honest Significant Difference) comes in handy.
Compare Each Pair of Means Using Tukey’s HSD
Tukey’s HSD finds out which specific groups’ means are different. The test compares all possible pairs of means.
Let’s use MultiComparision and itsturkeyhsd() method to test for multiple comparisons.
Explanation of the table above:
group1is compared togroup2meandiff: the mean difference betweengroup1andgroup2p-adj: how likelygroup1andgroup2to have the same meanslowerandupper: lower and upper bound of the confidence interval.reject: If it isTrue, the null hypothesis is rejected. There is enough evidence to claim that the means of the two levels of cotton being compared are significantly different.
Pairs of levels of cotton content that are statistically different:
- (15, 35)
- (20, 25)
- (20, 35)
- (25, 30)
To understand the results better, let’s look at the plots that visualize significant differences with one confidence interval per group.
The plot above compares the mean of group 15 (fiber with 15% cotton) colored in blue and the means of other groups.
- Since group 35’s mean is not statistically different from group 15’s mean, group 35 is colored gray.
- Since the mean of group 20, 25, and 30 are significantly different from the mean of group 15, they are colored red.
Select other options in the dropdown bar for other comparisons.
Check Model Assumptions
ANOVA assumes that each sample was drawn from a normally distributed population. To use ANOVA at all, we need to make sure that this assumption is met.
To test for normality, we will create a Q-Q plot of residuals. The Q-Q plot plots quantiles of the data versus quantiles of a normal distribution.
Since the data points fall along a straight diagonal line in a Q-Q plot, the dataset is likely to follow a normal distribution. Thus, the data satisfies ANOVA’s assumption of normality.
Conclusion
Congratulations! You have just learned how to use one-way ANOVA to compare the means of three or more independent groups. No matter how good your data is, if you don’t have a good testing technique, you won’t be able to extract meaningful insights from your data.
With ANOVA, you will be able to determine if differences in mean values between three or more groups are by chance or if they are indeed significantly different. Eventually, it will help you decide if it is beneficial to choose one group over others.
The source code of this article could be found here:
I like to write about basic data science concepts and play with different algorithms and data science tools. You could connect with me on LinkedIn and Twitter.
Star this repo if you want to check out the codes for all of the articles I have written. Follow me on Medium to stay informed with my latest data science articles like these:
Reference
“One-Way ANOVA.” One-Way ANOVA — An Introduction to When You Should Run This Test and the Test Hypothesis | Laerd Statistics, statistics.laerd.com/statistical-guides/one-way-anova-statistical-guide.php.