
Introduction to Datapane: A Python Library to Build Interactive Reports
Simple Framework to Create Beautiful Reports and Share your Analysis Results with your Team

Motivation
For many Python data analyses, sometimes you want to share your findings with others. Showing your work will help your team and manager keep up-to-date with your progress and build your reputation as a data scientist in your network. I mentioned about how sharing my work has leveraged my career in this article:
But sharing alone is not enough. Let’s say after cleaning your data and creating some charts for analyzing, you want to share with others your findings. The last thing you want to do is to share with non-technical people (such as your stakeholders) the whole code or notebook and ask them to install Jupyter Notebook and environments required to see your findings like the below:
“This is the .ipynb file. To view this file, you need to pip installthese packages. Then type on the command line Jupyter Notebook. Once you see the notebook, run all the cells and you should be able to see the data and visualization”.
As an alternative, you could take the picture of the visualization and put it in a deck, but viewers will not have much control over the visualization — they wouldn’t be able to use it interactively, explore any data, or change the input parameters. Additionally, every time they want a change, you’ll have to create another report manually.
The optimal strategy is to share a specific user-facing part without setting up the environments. Wouldn’t it be great if you can send them a link like this to your teammates or stakeholders
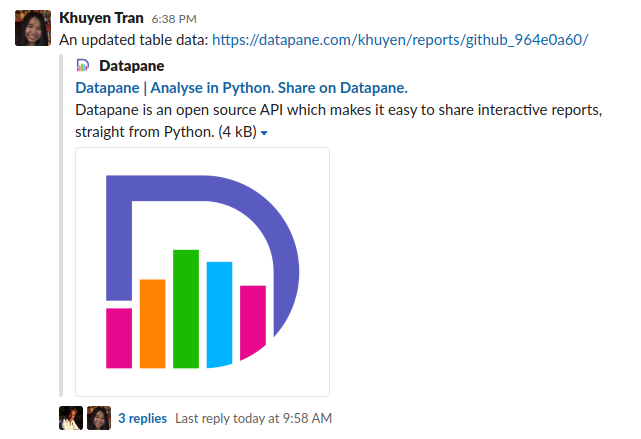
to view all of your findings in one place?
That is when you need a Python framework like Datapane.
What is Datapane?
Datapane is an API for people who analyze data in Python and need a way to share their results. It provides a way to create reports programmatically from components that wrap around the common objects in analyses, such as:
- Pandas DataFrames
- Plots from Python visualization libraries such as Plotly, Bokeh, Altair, and Folium
- Markdown
Once created, reports can be published on the web, dynamically generated in the cloud, or embedded into your own application, where data can be explored, and visualizations can be used interactively
Datapane also allows you to deploy your Python scripts and notebooks, so that other people can run them to generate reports from their browser without worrying about code, notebooks, or setting up a Python environment.
Let’s Try it Out!
Let’s say you have a script like this with Pandas Dataframe and Altair chart
To create a report, simply follow these steps
- Install Datapane with
pip3 install datapane- Sign up on Datapane to get your own token and use that token to login in datapane in your terminal
datapane login --server=https://datapane.com/ --token=yourtoken- Then simply add a few more lines of code to your existing analysis!
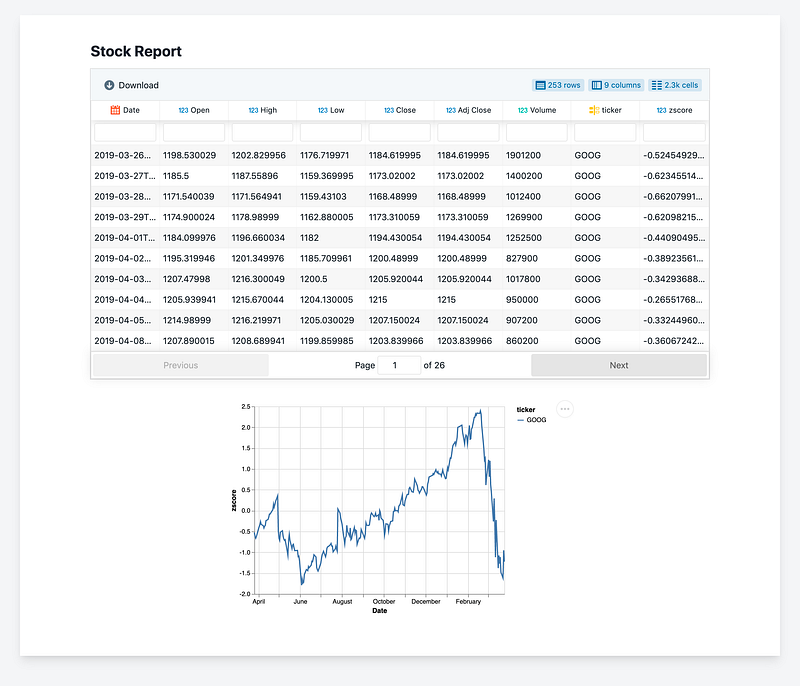
- Run the scripts and voila! A report is automatically created for you on Datapane.com!
https://datapane.com/khuyen/reports/stock_report_9eddadcd/
That’s it! Now all you need to do now is to share this link to your teammates or manager
Or share on social media

What else can I do with Datapane?
Enable Viewers to Enter New Parameters
Not only do you like the viewers to look at your report but you might also want to give them the ability to interact with the plots and plug in different parameters like this
With Datapane, others can generate your reports without worrying about code, notebooks, or setting up a Python environment. They could enter which parameters they would like to specify as input and will receive a dynamic report each time.
To deploy a script called stock_report.py, create a script like above then use Datapane’s CLI:
datapane script deploy --script=stock_report.py --name=stock_reportSee further instructions on how to deploy a script here.
Embedding Reports in Social Platforms
If you are a Medium writer or a blogger like me, you might want to embed a table or a plot like below:
With Datapane, you could embed your chart in Medium by simply copying and pasting the url published on Datapane on Medium. You can also embed them into Reddit, Confluence, Notion, or your own website.
Store Files and Objects on Datapane to Use in Multiple Scripts
Datapane provides a Blob API which allows you to upload files from any Python or CLI environment, and access them inside your scripts or through the CLI.
Let’s say you can use dp.Blob to save a dataframe, a file, or an object in blob.py, use
Then if you want to load them in another script, use
Download Tables and Charts from the Report
If your viewers want to download your table or chart, they could easily do that with Download button in the report.
Conclusion
Congratulations! You have just learned a new tool to add to your data science workflow along with your other favorite Python libraries.
I hope this article gives you a good headstart to try out Datapane. You could learn more about Datapane here. Comment below or send me a message on LinkedIn if you have any question about this tool.
I like to write about basic data science concepts and play with different algorithms and data science tools. You could connect with me on LinkedIn and Twitter.
Star this repo if you want to check out the codes for all of the articles I have written. Follow me on Medium to stay informed with my latest data science articles like these:


