
AN ESSENTIAL PYTHON GUIDE
COVID-19 Time Series Analysis with Pandas in Python
Manipulate and Analyze COVID-19 Time Series Data

In Data Sciences, the time series is one of the most daily common datasets. In this tutorial, I will show you a short introduction on how to use Pandas to manipulate and analyze the time series dataset with the confirmed COVID-19 case dataset from JHU CSSE.
Let’s Get Started
If you are very new to Pandas/Python, just download the latest version of Python and then you can install Pandas with pip in your console as below:
$ pip install pandasPrepare Data and Import to Dataframe
Let’s begin with preparing your project folder and download a time-series csv file from Johns Hopkins CSSE.
Then, create a new Python file and loading thecsv file into the Pandas dataframe:
import pandas as pd
df = pd.read_csv(f'time_series_covid19_confirmed_global.csv')
print(df)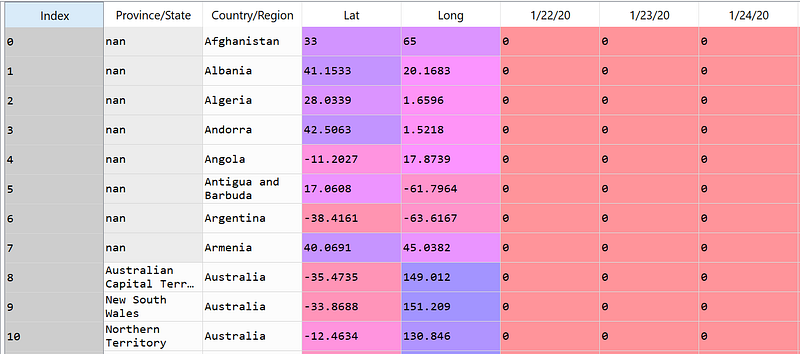
Data Cleaning
Now, let’s do some data cleaning. You can see that this dataset has the time-series represents a number of cases in the level of Province/State only in some areas so let’s aggregate all data into the level of Country/Region using groupby to sum up the number of cases.
Before the data aggregation, we may drop some fields that we are not interested including province/State, Lat, Long using drop .
df = df.drop(columns=['Province/State','Lat', 'Long'])
df = df.groupby('Country/Region').agg('sum')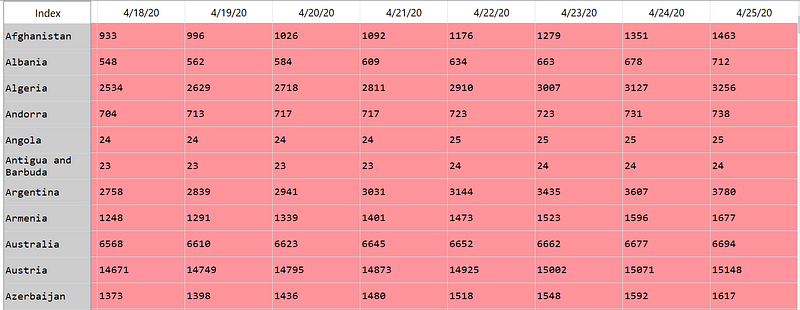
Prepare Datetime index in a Dataframe
Now, we get the time series of daily confirmed cases for each country. But to use the time series analysis function, we would need to create a DateTime as the index column. So, let’s transpose the dataframe first.
df = df.T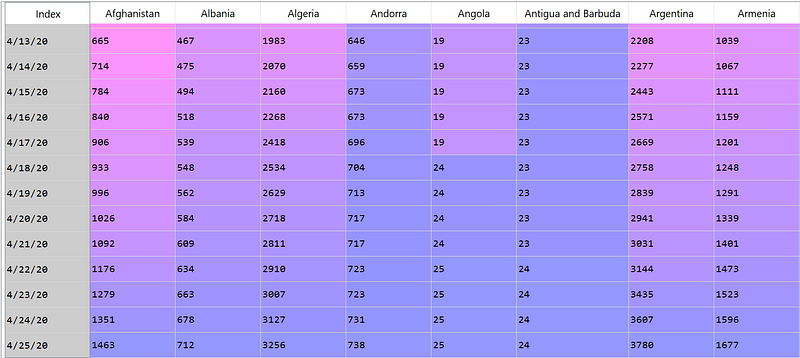
From here, the index represents the date value. However, it is still a String type, so let’s change it to DateTime. To do this, we can use pd.to_datetime and pd.DatetimeIndex as follows:
df_time = pd.to_datetime(df.index)
datetime_index = pd.DatetimeIndex(df_time.values)
df = df.set_index(datetime_index)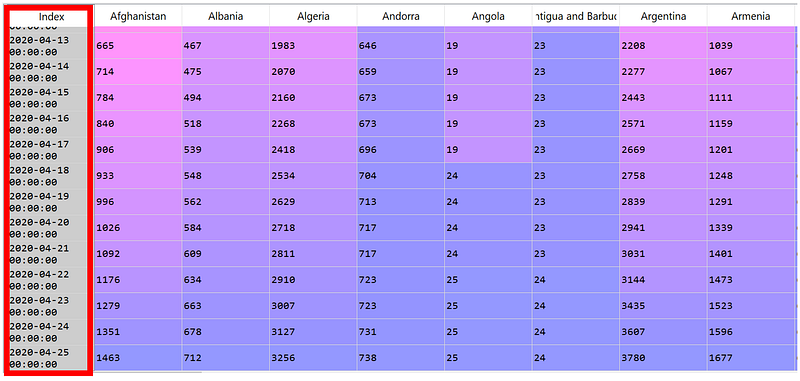
Explore the Time-Series Dataframe
Now, our time-series dataframe is ready with the datetime in the index. You may select data from any specific time. For example:
> Select the confirmed COVID-19 case where the date is 15th
df[df.index.day == 15]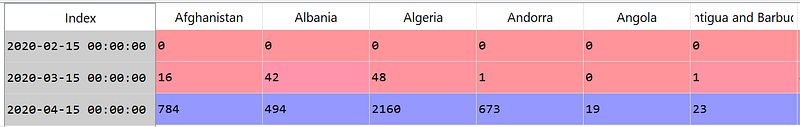
> Select the data where the month is April
df[df.index.month == 4] # April, all years
# or
df['2020-04'] # April, 2020
# or
df[(df.index.month == 4) & (df.index.year == 2020)] # April, 2020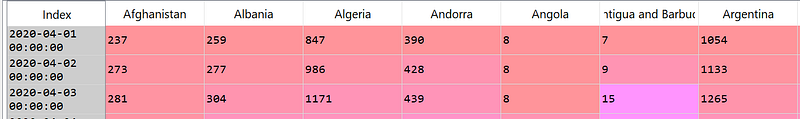
> Select the data from April 1, 2020, to April 5, 2020
df['2020-04-01':'2020-04-05']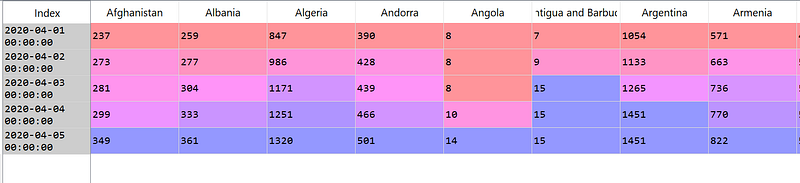
> Select 6 Countries with the most confirmed COVID-19 cases
#Sort by confirmed cases on the latest date (index.value[-1])
df = df.sort_values(by=df.index.values[-1], axis=1,ascending=False)
#Select first 6 countries
df = df.iloc[:,0:6]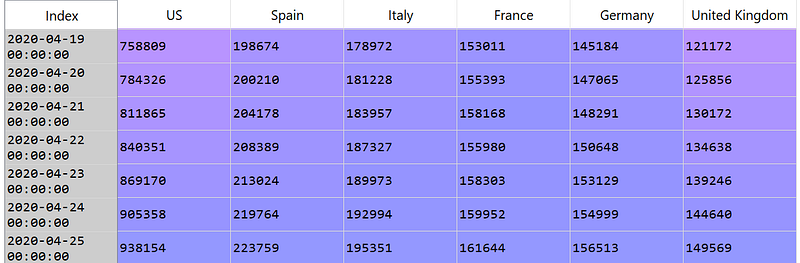
Resampling Time-Series Dataframe
Now, let’s come to the fun part. We can easily resample the time-series to any time-frequency with resample method. You may resample the time-series dataframes or series to any time-frequency you like with:
df.resample(<offet frequency>).<aggregation-operation>Here is a list of most used <offset frequency> aliases:
'nD'           ==> n days
'nM'           ==> n months
'nW'           ==> n weeks
'nD'           ==> n days
'nH'           ==> n hours
'nT' or 'nmin' ==> n mins
'nS'           ==> n seconds
'nL' or 'nms'  ==> n milliseconds
#or mix offset together
'nD.mH'        ==> n days, m hours
Here is a list of most used <aggregation-operation> :
# Summarize
df.resample(timeinterval).sum()
# Mean
df.resample(timeinterval).mean()
# Max
df.resample(timeinterval).max()
# Min
df.resample(timeinterval).min()
# First value
df.resample(timeinterval).first()
# Last value
df.resample(timeinterval).last()
# Standard deviation
df.resample(timeinterval).std()
Now, let’s try to use it with the real example in our COVID-19 dataset:
> Mean-resampled of confirmed COVID-19 cases in a weekly interval
#Resample the dataframe
df.resample('W').mean()
#You can plot the chart by adding .plot()
df.resample('W').mean().plot()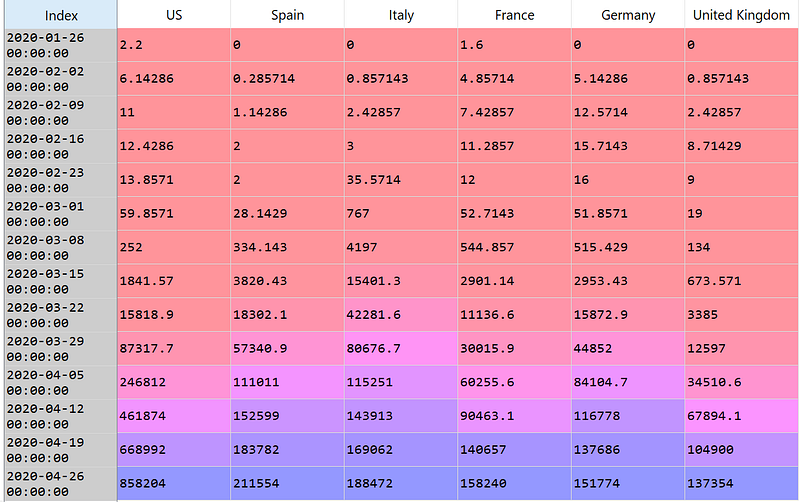
We can also plot any resampling result by using.plot(...) . For example:
df.resample('W').mean().plot(marker="v",figsize=(15,5))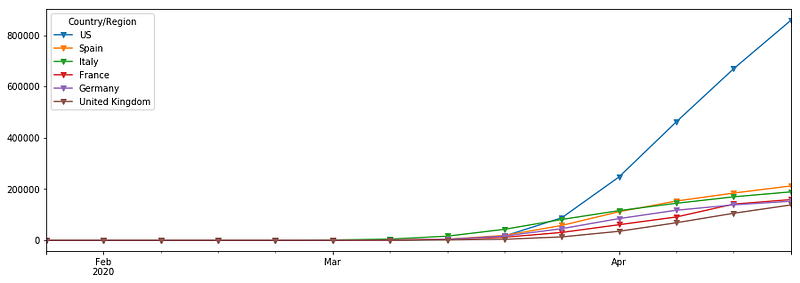
Percentage Growth
Now, let’s find a weekly percentage growth of COVID-19 in each country. We can do it by simply adding .pct_change() to find the percentage change.
df.resample('W').mean().pct_change()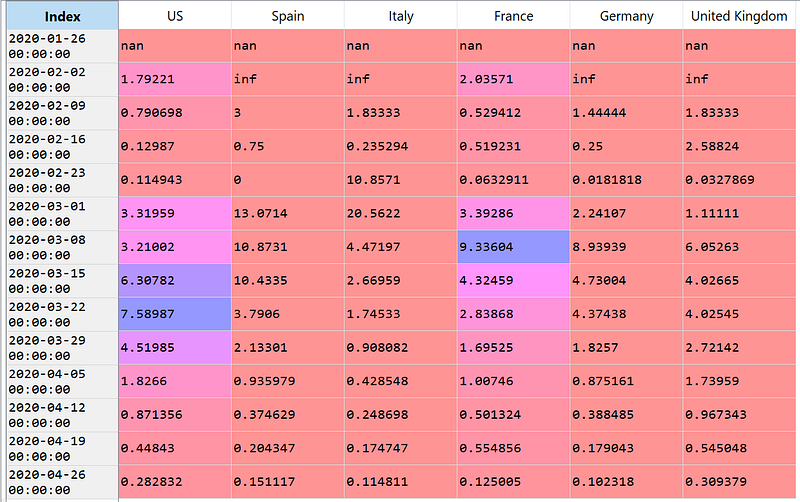
In this case, the first two lines contain some of nan and infso we can just ignore these lines by using iloc[2:] to skip the lines. Then, we can use plot to see the plot of the percentage growth of the confirmed COVID-19 cases.
df.resample('W').mean().pct_change().iloc[2:].plot(marker="v",figsize=(15,5))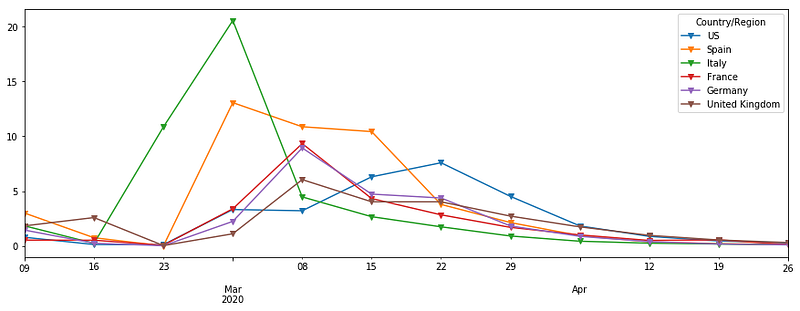
Identifying Trends in Time-Series Dataframe
There are many ways to analyze the trends of time series, the rollingis one of my most favorite tools. For each row or timestamp, it takes the rolling window calculations on both sides by:
df.rolling(<window size/ offset frequency>).<aggregation-operation>For example, let’s plot the rolling average of confirmed COVID-19 cases by window size of 10 days.
df.rolling('10D').mean().plot(marker="v",figsize=(15,5))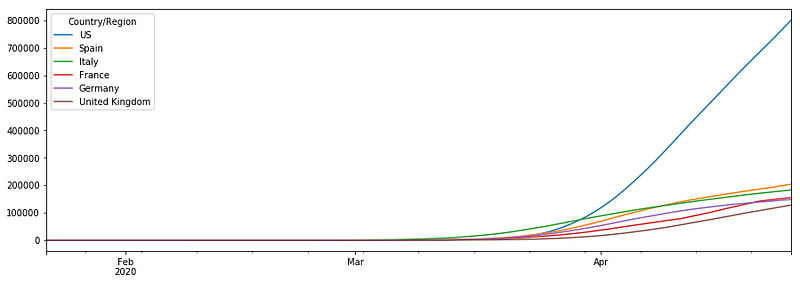
Conclusion
This article provides a basic guide on how to manipulate and analyze the time series data with an example of a confirmed COVID-19 cases dataset. Still, it only covers very basic parts and there are a lot more functionalities you can do with the time-series dataset. You can check a full guide on the official Pandas time-series webpage.
I hope you like this article and found it useful for your daily work or projects. Feel free to leave me a message if you have any questions or comments.
About me & Check out all my blog contents: Link
Be Safe and Healthy! 💪
Thank you for Reading. 📚


