Innovative Pattern Recognition Techniques in Trading
Applying Candlestick Patterns on Different Charting Systems

Candlestick patterns are one of the most important technical analysis indicators. Using them properly is key to a successful system. This article discusses applying a flexible form of the Engulfing pattern on K’s candlestick charts, a smooth form of candlestick charting seen in previous articles.
Quick Refresher on K’s Candlesticks
K’s candlesticks are 2-period exponential moving averages applied on each of the OHLC data. It resembles Heiken-Ashi charts in their reasoning. Their main aim is to smooth data and make the trend more visible. The following Figure shows a K’s candlestick.
We code a pattern and apply it on K’s candlesticks and then superimpose its signals on a real candlestick chart so that there is no bias.
Financial pattern recognition is no easy task, and the best way to dip your toes in this field is through candlestick pattern recognition. Learn how to detect classic and modern patterns using Python in my book published with O’Reilly Media! A dedicated GitHub is provided.
Applying the Pattern on K’s Candlesticks
The Engulfing pattern is a simple candlestick configuration where a candle completely envelops the previous one. This means that algorithmically, the conditions can be stated as follows:
- For a bullish Engulfing pattern: A bullish candle must be printed following a bearish candle. The bullish candle must have a close price greater than the previous candle’s open price and an open price below the previous candle’s close price.
- For a bearish Engulfing pattern: A bearish candle must be printed following a bullish candle. The bearish candle must have a close price below the previous candle’s open price and an open price greater than the previous candle’s close price.
However, with K’s candlesticks smoothed results, this may be harder than expected. This is why, a flexible form of the Engulfing can be created. In a way, we are simply modifying a few rules of the above conditions:
- For a bullish Engulfing pattern: A bullish candle must be printed following a bearish candle. The bullish candle must have a high price greater than the previous candle’s high price and a low price below the previous candle’s low price.
- For a bearish Engulfing pattern: A bearish candle must be printed following a bullish candle. The bearish candle must have a high price greater than the previous candle’s high price and a low price below the previous candle’s low price.
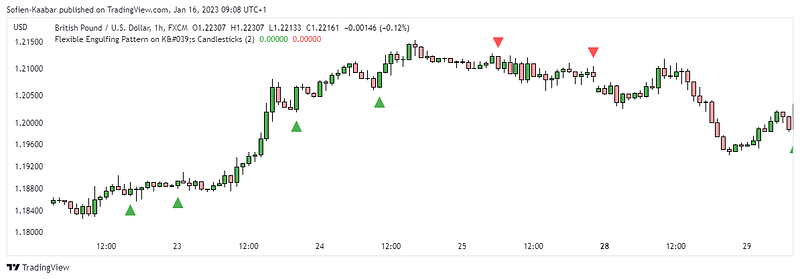
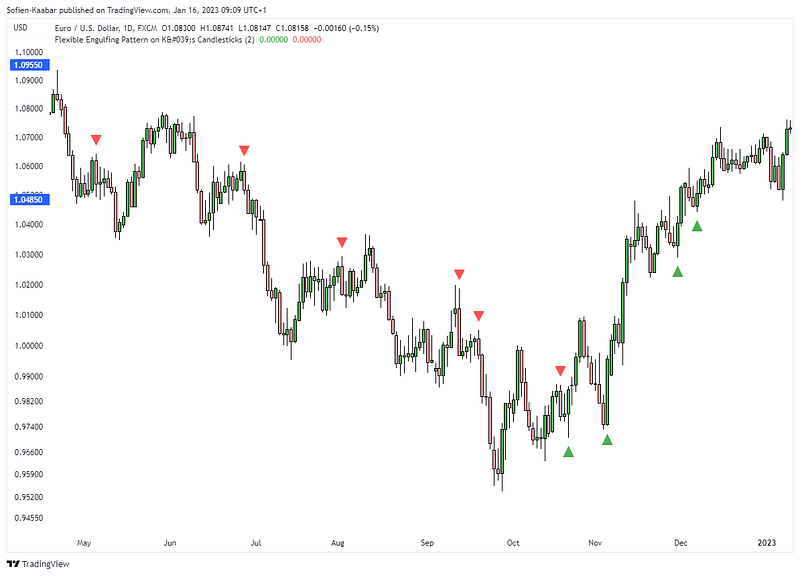
The next Figure shows a signal chart using the flexible form of the Engulfing pattern applied on K’s Candlesticks and superimposed on a regular candlestick chart. Furthermore, the bullish signals appear only whenever the market is above its 30-period moving average and the bearish signals appear only whenever the market is below its 30-period moving average.
This is to filter signals that are against the ongoing trend.
The code needed for this strategy is as follows:
// This source code is subject to the terms of the Mozilla Public License 2.0 at https://mozilla.org/MPL/2.0/
// © Sofien-Kaabar

//@version=5
indicator("Flexible Engulfing Pattern on K's Candlesticks", overlay = true)
lookback = input(defval = 2, title = 'Lookback')

open_price  = ta.ema(open, lookback)
high_price  = ta.ema(high, lookback)
low_price   = ta.ema(low, lookback)
close_price = ta.ema(close, lookback)

bullish_engulfing = close_price > open_price and close_price[1] < open_price[1] and close_price[2] < open_price[2] and high_price > high_price[1] and low_price < low_price[1] and close > ta.sma(close, 30)
bearish_engulfing = close_price < open_price and close_price[1] > open_price[1] and close_price[2] > open_price[2] and high_price > high_price[1] and low_price < low_price[1] and close < ta.sma(close, 30)

plotshape(bullish_engulfing,  style = shape.triangleup, color = color.green, location =  location.belowbar, size = size.small)
plotshape(bearish_engulfing,  style = shape.triangledown, color = color.red, location =  location.abovebar, size = size.small)