
In-game Analytics Pipeline with Redpanda, ClickHouse, and Streamlit
Build a scalable and low-latency leaderboard for video games.

Welcome to the exciting world of in-game analytics! Imagine being able to peek into the minds of your players, and understanding their likes, dislikes, and challenges.
In-game analytics, the process of collection and analysis of player behavior data, can provide valuable insights into how players interact with the game, which aspects they enjoy, and where they may encounter difficulties. By understanding these dynamics, developers can make informed decisions to improve gameplay, provide a more engaging user experience, and ultimately increase player retention.
In this post, we will discuss how to use ClickHouse and Redpanda to create a streaming data pipeline. This pipeline will collect and process gameplay events. Additionally, we'll use Streamlit to build a real-time leaderboard that displays the computed gameplay statistics.
The pipeline architecture - how Redpanda, ClickHouse, and Streamlit fit together
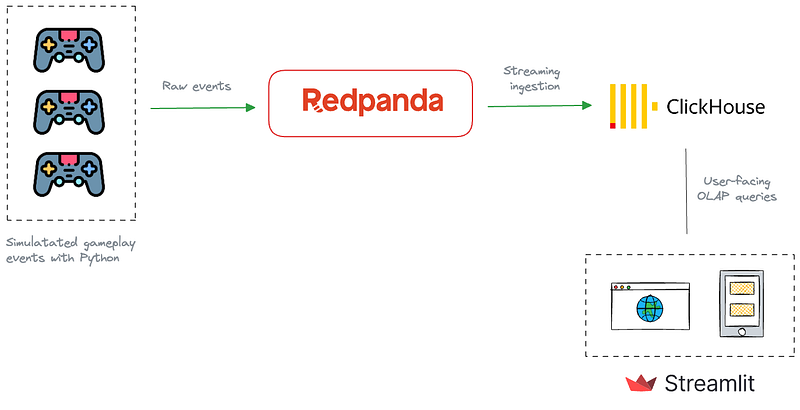
The data pipeline is composed of three key components—Redpanda, ClickHouse, and Streamlit. Let me explain the role each of them plays in the overall solution.
Redpanda serves as the streaming ingestion component, acting as the initial collector of gameplay events from gaming devices, including mobile and web apps, and gaming consoles. It captures and processes the data in real-time, ensuring that all game interactions are promptly recorded.
Redpanda shines here due to its scalability and its ability to support high-throughput, low-latency event ingestion.
Next, the pipeline needs a processing and serving component for ingested data. This is where ClickHouse comes into play. ClickHouse is a real-time Online Analytical Processing (OLAP) database, capable of real-time data ingestion from streaming data sources, such as Kafka and Redpanda. When the gaming data is ingested into Redpanda, ClickHouse consumes them in real-time, organizing it in a way that allows for efficient querying and analysis.
ClickHouse’s speed and efficiency make it ideal for handling the large volumes of data generated during gameplay.
Finally, the processed data is visualized through Streamlit, an open-source Python library that makes it easy to create beautiful, custom web apps for data products. We will use Streamlist to render the leaderboard computed by ClickHouse.
Building and running the pipeline
All of the code for this tutorial is located in Github. Run the following commands to clone the repository and switch to the directory for this tutorial.
git clone https://github.com/dunithd/gaming-leaderboard.git
cd gaming-leaderboard/completed
Also, make sure you have Docker Compose installed in your local workstation.
In a terminal, navigate to the completed directory, and start the stack by running:
docker-compose up -d
That will spin up a Redpanda cluster with a single broker, the Redpanda Console, and a ClickHouse cluster with one server.
Install Python dependencies
The solution depends on several Python libraries. Make sure you have Python 3.x installed in your system, along with pip.
Then install the dependencies by running:
pip install -r requirements.txtSet up Redpanda and simulate gameplay events
Create a Redpanda topic(gameplays) to hold the gameplay events:
docker-compose exec redpanda rpk topic create gameplaysrpk is the Redpanda CLI that allows you to interact with a Redpanda cluster to perform administrative tasks, such as managing topics, users, ACLs, etc.
Next, we will use a Python script to simulate gameplay events for 20 players. Run producer.py to produce random gameplay events for the gameplays Redpanda topic.
python producer.pyYou should see the gameplays event getting populated with JSON events.
Set up ClickHouse - create tables and materialized views
Let’s configure ClickHouse to ingest gameplay events from Redpanda.
Access the ClickHouse Playground web UI by visiting http://localhost:18123/play.
Run the following queries, one at a time to define the source table and the materialized view required.
CREATE DATABASE foo;

CREATE TABLE IF NOT EXISTS foo.scores_raw
(
    event_id String,
    game_id UInt64,
    player String,
    created_at DateTime,
    score UInt32
) ENGINE = Kafka()
SETTINGS
    kafka_broker_list = 'redpanda:9092',
    kafka_topic_list = 'gameplays',
    kafka_group_name = 'clickhouse-group',
    kafka_format = 'JSON'
The scores_raw table holds the raw gameplay events consumed from the gameplays topic. As you can see in the SETTINGS of the scores_raw table, we are asking the ClickHouse to use the Kafka engine to ingest from Redpanda. Why? Since Redpanda is compatible with Apache Kafka APIs, ClickHouse can read from Redpanda just like it would from Kafka.
Now, the problem is that we cannot query the scores_raw table directly because it is a Kafka engine table. Kafka engine tables in ClickHouse are used for streaming data ingestion and cannot be queried directly. Instead, we create materialized views based on the Kafka engine tables to process and store the data permanently.
Run the following query to create the final materialized view that serves our analytical queries.
CREATE MATERIALIZED VIEW foo.scores_view
ENGINE = Memory
AS
SELECT * FROM foo.scores_raw
SETTINGS
stream_like_engine_allow_direct_select = 1;
To verify whether the materialized view is getting populated, run the following query in the playground.
SELECT * FROM foo.scores_view;It should print all the results received from Redpanda so far.
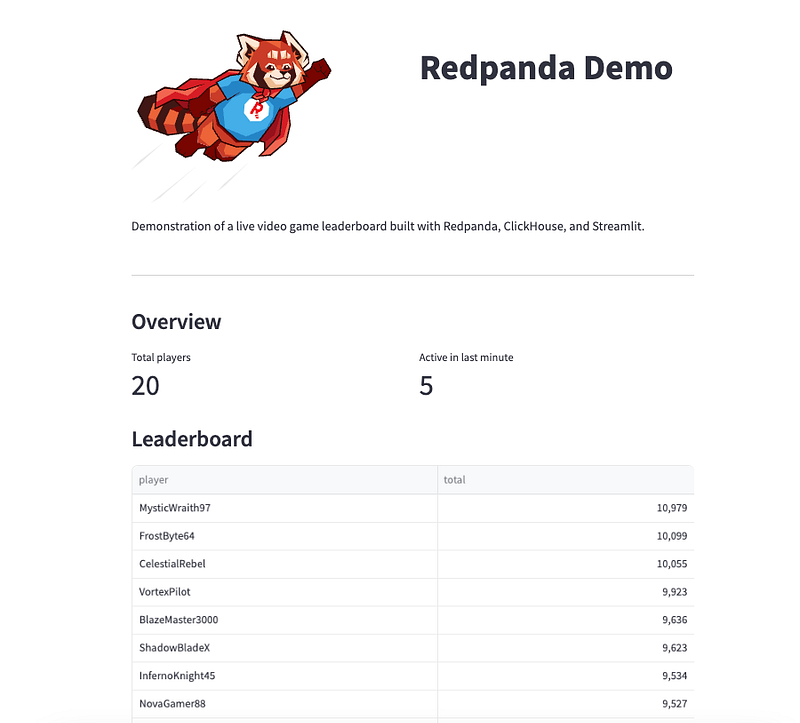
Run the Streamlit dashboard
Navigate to the streamlit directory and run the dashboard by:
streamlit run app.pyYou should see something like this when you visit http://localhost:8501/
Clean up
Shutdown the stack by running:
docker-compose down
Wrap up
In this post, we delved into the realm of in-game analytics and explored how to set up a robust real-time data processing pipeline using Redpanda, ClickHouse, and Streamlit.
We learned how Redpanda serves as the initial collector of gameplay events, providing scalability and low-latency event ingestion. Then, we saw how ClickHouse, with its Online Analytical Processing capabilities, consumes and organizes the game data for efficient querying and analysis. Finally, we used Streamlit to visualize the processed data in a real-time leaderboard.
You can take this pipeline to the next level if we use a stream processor like Apache Flink for preprocessing raw gameplay events. Flink can be helpful in stateless transformations like filtering, scrubbing, and transforming raw events, as well as stateful operations like joins, windowing, and event time processing.
By leveraging these technologies, game developers can gain valuable insights into player behaviors and interactions, thus enabling them to enhance the gaming experience and boost player retention.


