
Implementing the logging stack using Promtail, Loki, and Grafana using Docker-Compose.

In my previous blog post, I delved into the powerful combination of Node Exporter, Prometheus, and Grafana for robust monitoring. This exploration prompted me to explore the flip side of monitoring, which involves tracking logs. When it comes to log monitoring, Promtail and Loki work seamlessly together. In this blog, I’ll guide you through a step-by-step introduction and installation process using Docker Compose.
Introduction
There are 3 important component when it comes to log monitoring:
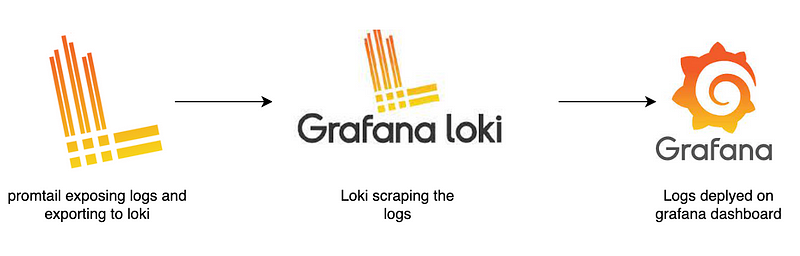
Promtail: Promtail is essentially an agent that takes its inspiration from Prometheus. Its primary role is to collect logs based on the configuration specified in the scraping settings. These logs are then transported to Loki for storage and further analysis.
Loki: Loki serves as a specialized data store tailored for log storage. It efficiently stores logs, making them easily retrievable for analysis and monitoring purposes. Unlike traditional log storage systems, Loki’s design is optimized for scalability and performance in handling vast amounts of log data.
Grafana: Grafana plays a crucial role in this monitoring stack. Once the logs are stored in Loki, Grafana steps in to visualize and present this data on a dashboard. Grafana’s user-friendly interface allows for the creation of insightful and customizable dashboards, making it easier for users to interpret and analyze the log data in real time.
Story Time!
Imagine Promtail as a diligent messenger bee buzzing around, collecting tiny pieces of information (logs) from different flowers (scrape configurations). This bee then delivers its findings to Loki, a cozy hive specifically designed to store these bits of information. Finally, Grafana acts like a friendly beekeeper, skillfully organizing and presenting the honey (logs) from the hive on a beautiful and easy-to-read honeycomb-shaped dashboard. Together, they create a harmonious ecosystem where information flows seamlessly, just like a well-coordinated bee
Installing Docker on macOS
Installing Docker on macOS is a straightforward process:
- Download the appropriate .dmg image for your Mac from here https://docs.docker.com/desktop/install/mac-install/ Do note that there are two versions available: one for Apple’s M1 chip and another for Intel processors.
- Once downloaded, open the .dmg file, and follow the interactive installation steps.
With Docker installed, we’re one step closer to understanding our monitoring stack in action!
Setting up logging stack
Let’s begin by setting up our project structure. First, create a directory named docker-compose. Within this directory, create a YAML file named docker-compose.yaml.
Now, we’ll delve into the creation and understanding of the Docker Compose file. Before we dissect its components, I strongly recommend that you copy and paste the provided file (found at the end of this guide) into your docker-compose.yaml. Familiarizing yourself with its content will make the subsequent explanations much clearer
The most important values of the docker compse yaml file is
- version: Think of this as the version of the blueprint or plan you’re using to set up your city. It’s a specific design that ensures everything fits together correctly. Version of Dcoekr compose
- services: This section lists all the departments or services you’re going to have in your city. In technical terms all the tools
- image: This tells us which building design or blueprint (in this case, a Docker image). It’s like specifying which model of a building you want to construct.
- ports: This section is about the city’s entry and exit points. It dictates how the outside world can communicate with our city (or in technical terms, communicate with the service).
- volumes: Think of volumes as storage facilities or warehouses in our city. They’re places where we store important items, records, or goods. In the context of Docker, volumes are used to store and manage data outside of the container’s file system, ensuring that even if a building (or container) is torn down and rebuilt, the valuable goods (data) inside the warehouse (volume) remain safe.
Lets see the docker-compose yaml file which will be running in our local setup.
version: '3.7'
services:
  loki:
    image: grafana/loki:latest
    ports:
      - 3100:3100
    volumes:
      - ./loki-config.yml:/etc/loki/loki-config.yaml
  promtail:
    image: grafana/promtail:latest
    volumes:
      - ./promtail-config.yml:/etc/promtail/promtail-config.yaml
  grafana:
    image: grafana/grafana
    ports:
      - 3000:3000
To make our lives easier and to allow for changes without having to dive into the container each time, we’ll mount it to a location on our local machine. This way, we can readily add or edit endpoints in the scrape_configs section of the configuration.
Promtail and Loki each possess dedicated configuration files, seamlessly incorporated through mounted volumes. These files serve to define essential parameters such as listening ports, client URLs, and scrape configurations, allowing for a flexible and externalized management approach.
Let's breakdown the loki-config.yml:
auth_enabled: false

server:
  http_listen_port: 3100
  grpc_listen_port: 9096

common:
  instance_addr: 127.0.0.1
  path_prefix: /tmp/loki
  storage:
    filesystem:
      chunks_directory: /tmp/loki/chunks
      rules_directory: /tmp/loki/rules
  replication_factor: 1
  ring:
    kvstore:
      store: inmemory

query_range:
  results_cache:
    cache:
      embedded_cache:
        enabled: true
        max_size_mb: 100

schema_config:
  configs:
    - from: 2020-10-24
      store: tsdb
      object_store: filesystem
      schema: v12
      index:
        prefix: index_
        period: 24h
Authentication:
auth_enabled: false: Authentication is disabled. No need for users to provide credentials.
Server Configuration:
http_listen_port: 3100: Loki server listens for HTTP requests on port 3100.grpc_listen_port: 9096: Loki server listens for gRPC (Google Remote Procedure Call) requests on port 9096.
Common Configuration:
instance_addr: 127.0.0.1: Loki's instance address is set to localhost (127.0.0.1).path_prefix: /tmp/loki: Loki uses/tmp/lokias a path prefix for various operations.storage: Specifies Loki's storage configuration.filesystem: Loki stores chunks and rules on the local filesystem.chunks_directory: /tmp/loki/chunks: Directory for storing chunks.rules_directory: /tmp/loki/rules: Directory for storing rules.replication_factor: 1: The replication factor is set to 1, meaning there's a single copy of each piece of data.ring: Configuration related to distributed storage.kvstore: Key-Value store settings.store: inmemory: Loki uses an in-memory key-value store.
Query Range Configuration:
results_cache: Configures result caching for query ranges.cache: Specifies the cache settings.embedded_cache: Embedded cache is enabled with a maximum size of 100 MB.
Below is the promtail-config.yml file:
server:
  http_listen_port: 9080
  grpc_listen_port: 0

positions:
  filename: /tmp/positions.yaml

clients:
  - url: http://loki:3100/loki/api/v1/push

scrape_configs:
- job_name: system
  static_configs:
  - targets:
      - "localhost"
    labels:
      job: varlogs
      __path__: /var/log/*log
Server Configuration:
http_listen_port: 9080: Loki server listens for HTTP requests on port 9080.grpc_listen_port: 0: The gRPC (Google Remote Procedure Call) server port is set to 0, which means it's dynamically assigned by the system.
Positions:
filename: /tmp/positions.yaml: Specifies the file path where Loki will store the positions of log entries. This information helps Loki keep track of which log entries it has already ingested.
Clients:
- Specifies the Loki server URL that Promtail should push logs to.
- url: http://loki:3100/loki/api/v1/push: Promtail sends log entries to Loki using this URL.
Scrape Configurations:
scrape_configs: Describes the jobs or sources that Promtail should scrape logs from.- job_name: system: Defines a job named "system."static_configs: Specifies static configurations for this job.- targets: - "localhost": Promtail will scrape logs from the local machine ("localhost").labels: Provides additional metadata for the scraped logs.job: varlogs: Assigns the label "job" with the value "varlogs."__path__: /var/log/*log: Defines a target path pattern ("/var/log/*log") where Promtail should look for log files.
Now, let’s bring our configuration to life by launching the Docker Compose setup! Run:
docker-compose up -d
Check the status of the docker containers:
docker-compose ps

Once the container is up, Grafana can be accessed on localhost:3000. Data source needs to be added under Configuration. Add http://loki:3100 in the URL and hit the save and test.
In a Docker Compose context, inter-container communication is facilitated using service names, not the typical local host address. Therefore, while the default endpoint for Prometheus might be http://localhost:3100 when accessed outside of the containerized environment, within a Docker Compose network, it should be referenced as http://loki:9090. This follows the pattern: http://service-names serve as DNS resolvable hostnames within the Docker Compose network, enabling seamless service-to-service interaction.
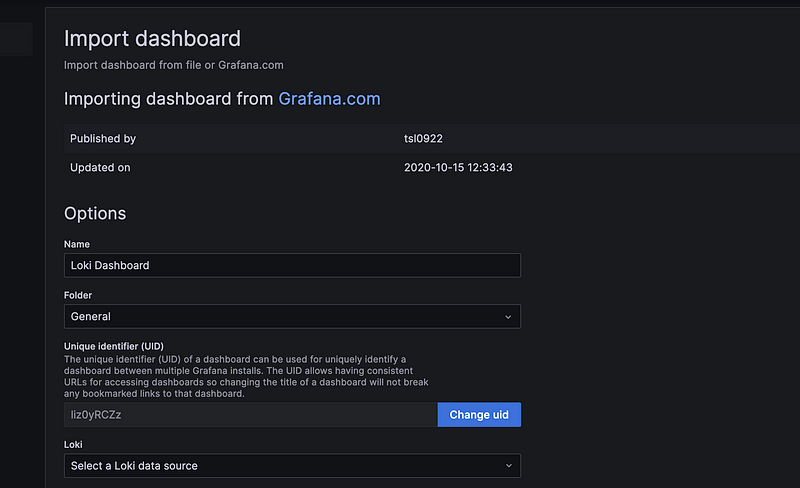
Loki dashboard can be imported using the ID or import the json file.
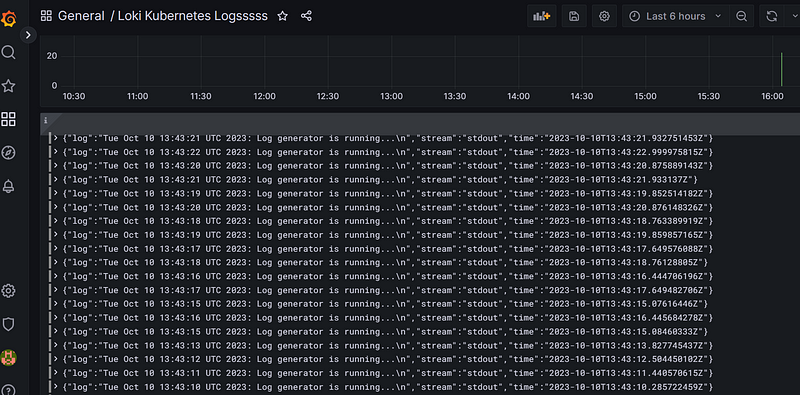
The dashboard will look like this:
Conclusion
In summary, setting up a comprehensive monitoring solution requires careful consideration and a structured configuration. Starting with the foundational creation of directories and files. Grasping the flow and roles of each component in this monitoring stack is key. Once you have a clear understanding, configuring the system becomes a manageable task. Indeed, when configured correctly, this combination forms a robust and powerful monitoring stack, capable of efficiently collecting, storing, and visualizing log data for effective system monitoring and analysis.
The best way to truly understand and gain confidence in any system or configuration is to give it a hands-on try locally. So, go ahead and explore the setup yourself; it’s the most effective way to learn and overcome any perceived challenges. Happy experimenting!


