
Implementing a Support/Resistance Breakout Strategy (Python Tutorial)

Sometimes an explosive upward trend breakout shatters the roof of a resistance level and takes the price to new heights. These are the types of major price movements that can be very profitable for traders.
In this post we are going to discuss what support and resistance are, how the resistance breakout strategy works and how it can be implemented step-by-step in Python.
This story is solely for general information purposes, and should not be relied upon for trading recommendations or financial advice. Source code and information is provided for educational purposes only, and should not be relied upon to make an investment decision. Please review my full cautionary guidance before continuing.
What are Support/Resistance and Breakout?
Support and resistance are concepts in technical analysis for trading that help us determine where a price may stop and reverse the current direction. They exist due to an accumulation or demand and supply at these price levels.
Support
A level of support is created when the price fall is stopped due to an increasing level of demand for the asset and consequently the price trend is reversed. If this event occurs multiple times, a level of support is assumed.
Resistance
In opposite, a level of resistance is created when the rise of a price is stopped due to an increasing level of supply. As more and more people are selling the asset due to an attractive price, the price trend is reversed and the price starts falling again. If this happens multiple times, the price level is called a level of resistance.
Breakout
A breakout occurs at times when overwhelming supply or demand causes the price to break through a level of support or resistance and continues to move in the same direction.
For example, as company A’s price is at the price level of resistance, the company’s earnings are published and surprisingly beat analyst’s estimates. As a consequence positive news coverage increases, more investors buy the stock and the overwhelming demand drives the price through the previous level of resistance.
These are the type of events we are going to leverage as a trading strategy in this post.
Of course a breakout can also occur when the price continues falling at a level of support.
Trade Ideas provides AI stock suggestions, AI alerts, real-time stock market data, charting, scanning, automated trading, educational resources, and more. Get a 15% discount with promo code ‘BOTRADING15’.
The Strategy
For this strategy we are going to use two concepts: Agglomerative Clustering, which I covered in this post and the Average Directional Index (ADX), which I discussed in this post. If you are not familiar with these subjects, I suggest you read those posts first.
Here’s the plan for the ‘Resistance Breakout’ Strategy:
Long Entry:
- First, we need to determine the levels of support and resistance for a range of dates.
- When find events when the price rises to a level of resistance and breaks through that level.
- At the same time we will use the ADX indicator to determine the strength of the trend. We will check for a value of 25. This is to prevent that a weak price trend ends in a failed breakout.
- We will also check the ADX positive (+DI) and negative (-DI) indicators for the price direction. In this case the +DI has to be above the -DI.
Long Exit
In this strategy we are only interest in exploiting that first, explosive upward trend after the breakout. So as an exit strategy, I’m just going to use a trailing stop loss and stop loss combination.
- Trailing stop loss of 1%
- Stop loss of 5%.
Implementation
As a backtesting framework I used backtesting.py.
Below I just added the most important functions you will need to implement this strategy.
You can download the complete Python script from my blog ‘B/O Trading Blog’.
This function calculates the support and resistance levels using the sklearn Agglomorative Clustering class.
from sklearn.cluster import AgglomerativeClustering

def calculate_support_resistance(df, rolling_wave_length, num_clusters):
    date = df.inde
    # Reset index for merging
    df.reset_index(inplace=True)

  # Create min and max waves
  max_waves_temp = df.High.rolling(rolling_wave_length).max().rename('waves')
  min_waves_temp = df.Low.rolling(rolling_wave_length).min().rename('waves')
  max_waves = pd.concat([max_waves_temp, pd.Series(np.zeros(len(max_waves_temp)) + 1)], axis=1)
  min_waves = pd.concat([min_waves_temp, pd.Series(np.zeros(len(min_waves_temp)) + -1)], axis=1)
  #  Remove dups
  max_waves.drop_duplicates('waves', inplace=True)
  min_waves.drop_duplicates('waves', inplace=True)
  #  Merge max and min waves
  waves = max_waves.append(min_waves).sort_index()
  waves = waves[waves[0] != waves[0].shift()].dropna()
  # Find Support/Resistance with clustering using the rolling stats
  # Create [x,y] array where y is always 1
  x = np.concatenate((waves.waves.values.reshape(-1, 1),
                      (np.zeros(len(waves)) + 1).reshape(-1, 1)), axis=1)
  # Initialize Agglomerative Clustering
  cluster = AgglomerativeClustering(n_clusters=num_clusters, affinity='euclidean', linkage='ward')
  cluster.fit_predict(x)
  waves['clusters'] = cluster.labels_
  # Get index of the max wave for each cluster
  waves2 = waves.loc[waves.groupby('clusters')['waves'].idxmax()]
  df.index = date
  waves2.waves.drop_duplicates(keep='first', inplace=True)
  return waves2.reset_index().waves
Here are the helper functions to calculate the ADX and positive/negative DI using the TA lib.
from ta.trend import ADXIndicator

def ADX(df, window):
    indicator_adx = ADXIndicator(high=df['High'], low=df['Low'], close=df['Close'], window=window)
    return indicator_adx.adx()

def ADX_NEG(df, window):
    indicator_adx = ADXIndicator(high=df['High'], low=df['Low'], close=df['Close'], window=window)
    return indicator_adx.adx_neg()

def ADX_POS(df, window):
    indicator_adx = ADXIndicator(high=df['High'], low=df['Low'], close=df['Close'], window=window)
    return indicator_adx.adx_pos()
Here the strategy rule implementation:
        #  LONG ENTRY
        #----------------------------------------------
        #  calculate support/resistance levels
        rolling_wave_length = 20
        num_clusters = 4
        if self.i < 200 + rolling_wave_length:
            return
        #  Grab a subset of the data
        support_resistance_lb = self.data.df.iloc[-200 - rolling_wave_length:]
        #  Calculate support/resistance
        support_resistance_levels = calculate_support_resistance(support_resistance_lb, rolling_wave_length, num_clusters)
        #  Check resistance crossover
        current_price = self.data.Close[-1]
        for level in support_resistance_levels.to_list():
            if self.data.Close[-1] >= level and self.data.Close[-2] <= level:
                long_entry_signal += 1
                break
        #  ADX trend strength
        if self.adx[-1] >= self.adx_strength_threshold:
            long_entry_signal += 1

        #  Check trend direction
        adx_pos = self.adx_pos_neg[0]
        adx_neg = self.adx_pos_neg[1]
        if adx_pos[-1] > adx_neg[-1]:
            long_entry_signal += 1

        #  LONG EXIT
        #----------------------------------------------
        #  Stop loss
        if self.long_hold == 1 and current_price <= (self.last_purchase_price * (1 - (self.stop_loss_pc/100))):
            long_exit_signal += 1
        #  Track max price after long entry
        if self.long_hold == 1 and current_price > self.long_peak_price:
            self.long_peak_price = current_price
        #  Trailing stop loss
        trailing_stop_price = self.long_peak_price * (1 - (self.trailing_stop_pc/100))
        if self.long_hold == 1 and current_price <= trailing_stop_price:
            long_exit_signal += 1
Results
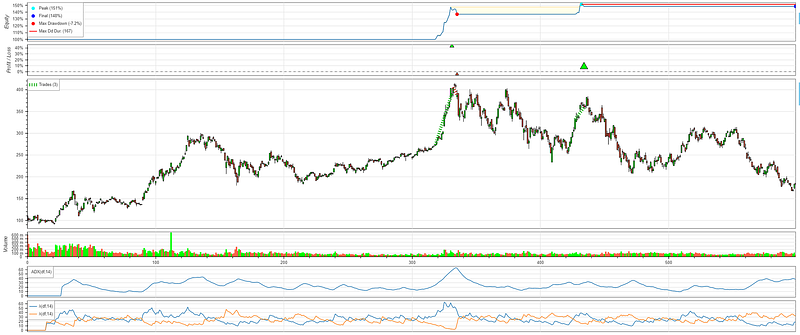
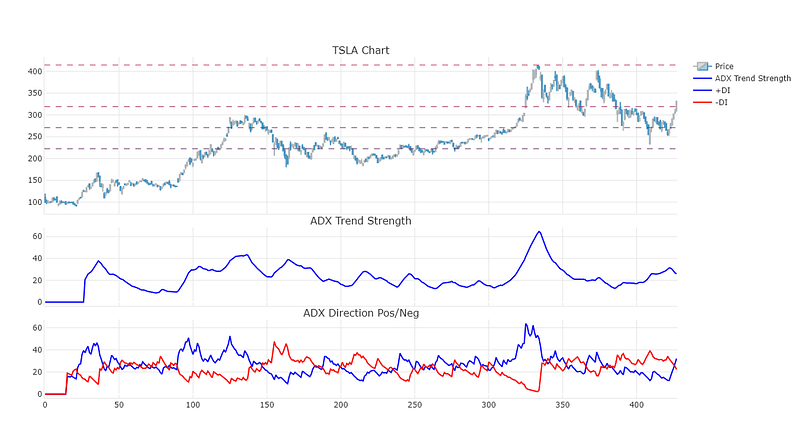
As backtest data I decided to use daily Tesla (TSLA) OHLC data for 600 periods. You can see how our resistance breakout strategy played out in the main chart. We had two wins and one loss and a final result of 148% return.
The first chart below the main chart is the ADX indicator, which indicates the strength of a trend.
The chart below the ADX chart are the positive (blue) +DI and negative (orange) -DI indicators. The price direction is upward when the +DI is above the -DI and vice versa.
Note that we need 200 periods lead time to calculate the support/resistance levels. In the periods between 200 and 300, there wasn’t much price volatility as the price stayed between the levels of support and resistance.
The time the price breaks through the resistance level is at period 318 and we can take advantage of the long upward breakout.
Next is the loss, a failed breakout where out strategy triggered but the long upward trend failed to continue. In this case our stop loss prevented major losses.
The second win is another instance where the price broke through the level of resistance and our strategy paid off.
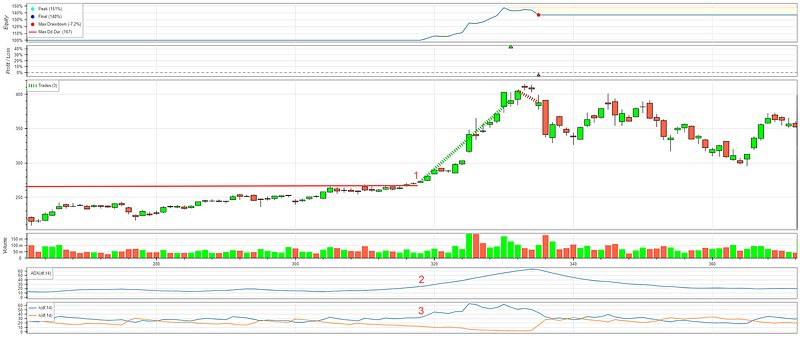
Here is out plot of the support/resistance levels at period 318. Note that the price is crossing the second level from the top at the top right corner of the chart.
The ADX strength indicator is above 25 and the ADX positive indicator is above the negative ADX indicator, which indicates that the price moves upwards.
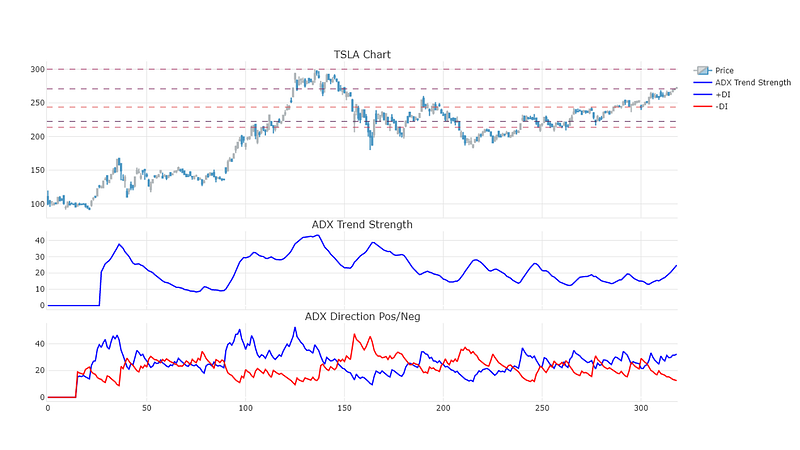
The chart below shows the failed breakout at period 332. The price crosses the last resistance level on the top but does not continue since we are at the end of the upward trend and the breakout fails to continue.
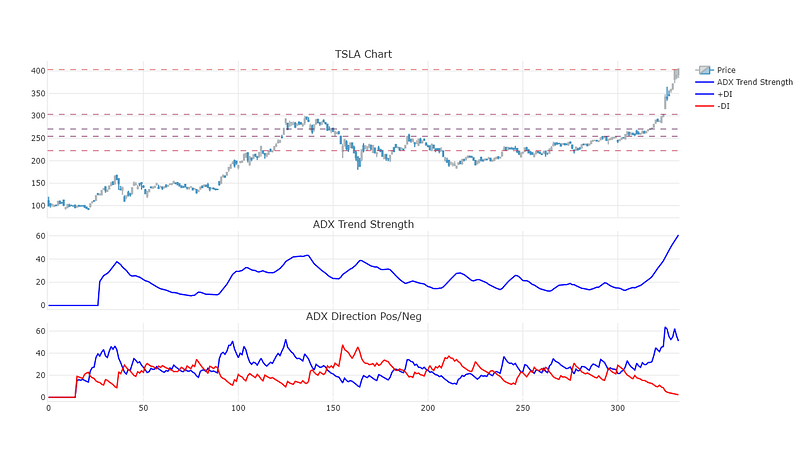
Here a plot of the last win at period 417, in which our strategy paid off again.
Wrapping Up
In this post we are discussed what support and resistance are, how a resistance breakout strategy works and went over the steps how to implement the strategy in Python. We finished up by looking at some of the results of this strategy.
I hope you found this post worth your time.
Special: Become my referred member for free and I will give you a free 1-year subscription to my blog ‘B/O Trading Blog’. After becoming a member, send me a quick email to botradingblog(a)gmail.com and I will sign you up.
You can support my writing for free using this link. Don’t miss another story — subscribe to my stories by email.
This post contains affiliate marketing links.
Have a great day!


