
I made a BI on Tableau dashboard! in Star Wars! (in JsonFile)
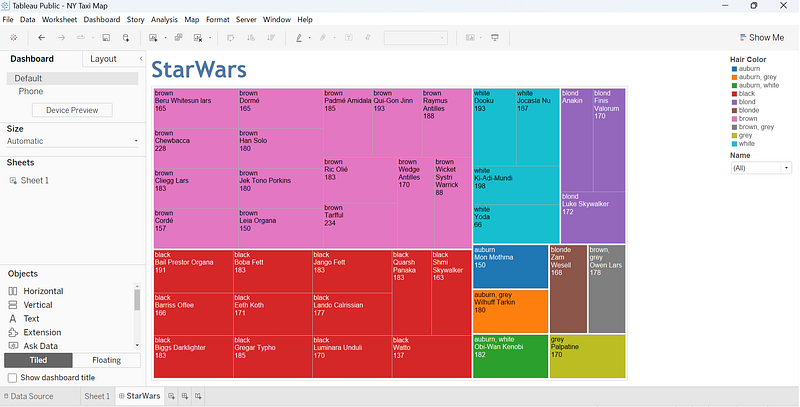
This time we will use a file with the extension Jsonfile. The completed image is shown below. Let’s begin!
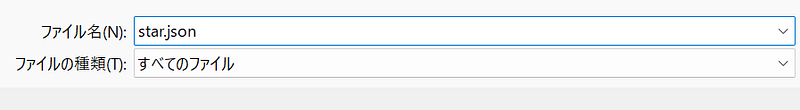
In this case, a file with a Jsonfile extension is used. However, there is nothing difficult to do. Just type “json” when saving the file. Reference data can be found at the following URL
https://public.tableau.com/app/resources/sample-data

Copy the above file to Notepad. Also, add “.json” to the end of the name when saving the file.
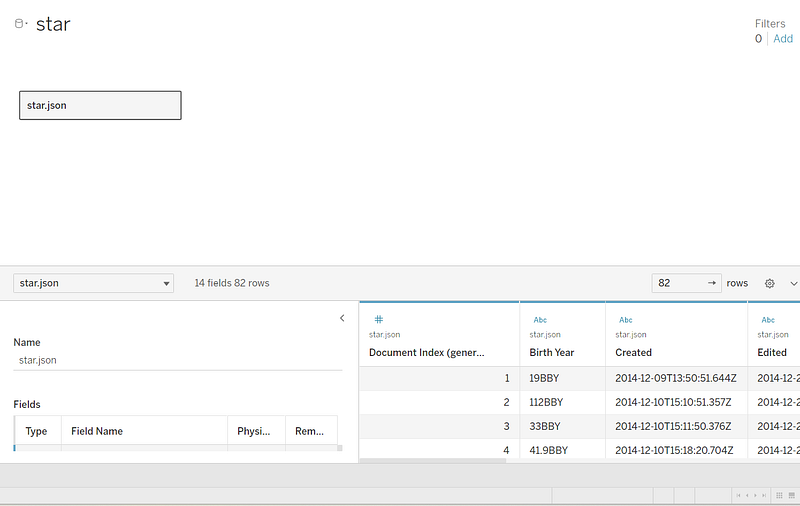
This will complete the following file.
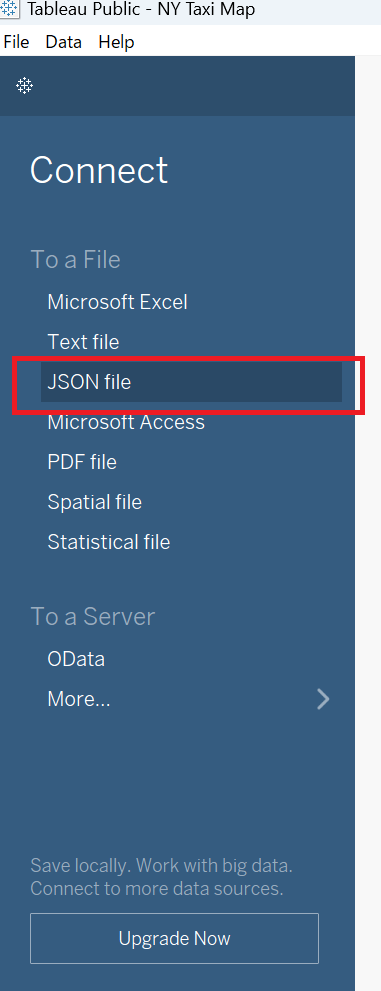
From Tableau, click on the button with the red border in the lower left corner.
When loaded correctly, it will appear as follows! Excellent!
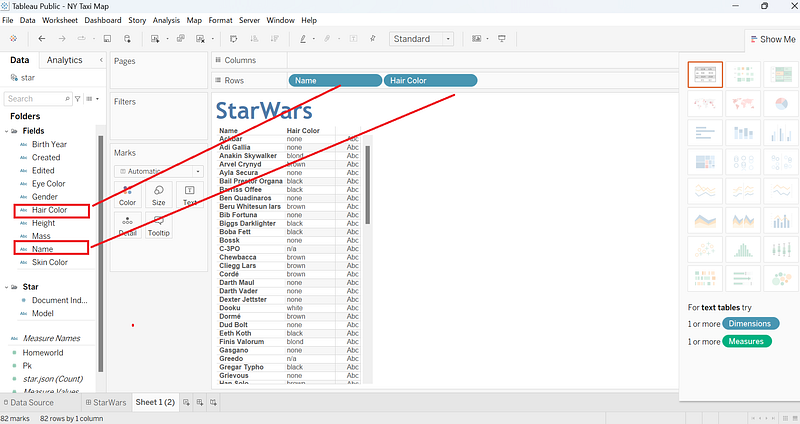
Go to the sheet and drag and drop the items on the left.
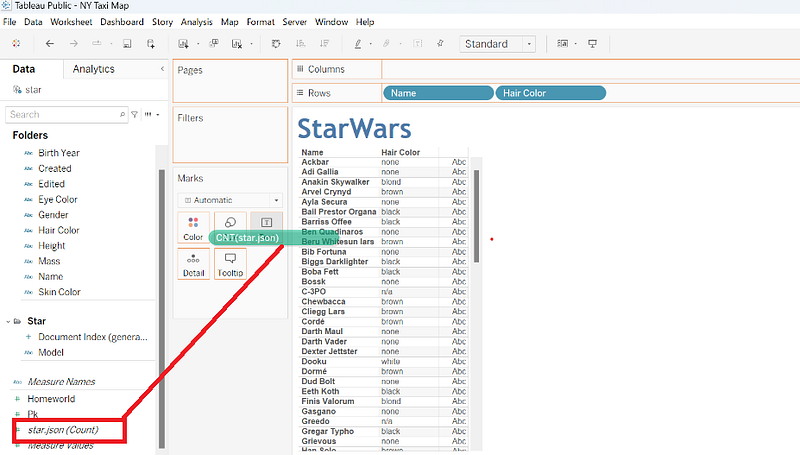
Then drag and drop the key number in the lower left corner as shown in the image.
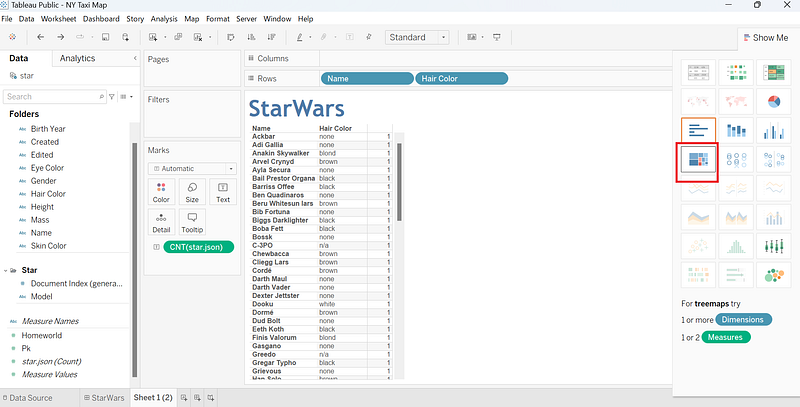
Select the red frame area in the upper right corner.
Drag and drop the items on the left part to “color” as shown below.
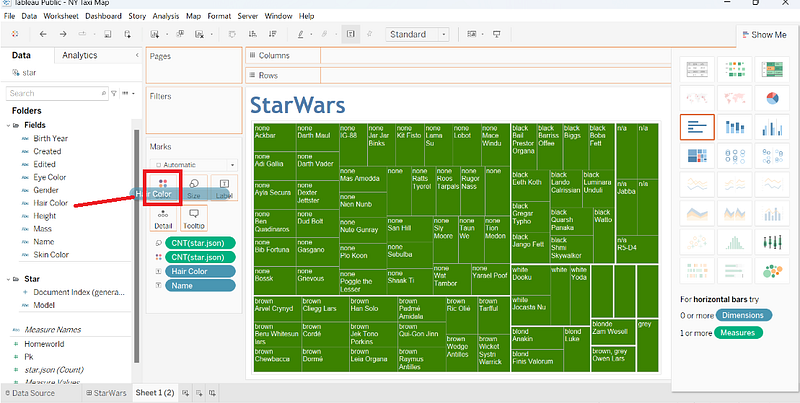
Wow!The completed dashboard looks like this!
If you are interested in Tableau, please give it a try. Tableau public is free to use. We are using Tableau public again this time. Please enjoy. Thank you for your interest. Thank you very much.