avatarMarilyn Flower

Free AI web copilot to create summaries, insights and extended knowledge, download it at here

3969

Abstract

lors, and no axes by default, streamlining the process of plotting vector data. If needed, you can easily customize the appearance using gspatial_plot, Geopandas, or Matplotlib parameters.</p><div id="7f83"><pre>gsp<span class="hljs-selector-class">.shapeplot</span>(usa, figsize=(<span class="hljs-number">15</span>, <span class="hljs-number">15</span>))</pre></div><figure id="5a4f"><img src="https://cdn-images-1.readmedium.com/v2/resize:fit:800/1*hgepISp4blKLRyoMFCcqAg.png"><figcaption></figcaption></figure><p id="970d">You also have the option to adjust the parameters according to your needs. For instance, let’s incorporate a title into the visualization:</p><div id="b7f0"><pre>gsp.shapeplot( usa, title=<span class="hljs-string">"USA MAP"</span>, title_kwds={<span class="hljs-string">"fontsize"</span>: 25, <span class="hljs-string">"fontname"</span>: <span class="hljs-string">"sans-serif"</span>, <span class="hljs-string">"fontweight"</span>: 3}, )</pre></div><figure id="4438"><img src="https://cdn-images-1.readmedium.com/v2/resize:fit:800/1*mIWUUXOP3u1uiZXQs_N2Lg.png"><figcaption></figcaption></figure><p id="1dc8"><b>Here’s the explanation of the shapeplot function’s parameters:</b></p><p id="7d22">• data (GeoDataFrame): GeoDataFrame used as the data source for the map. • title (str): Title displayed on the map. Default is None. • title_kwds (dict): Keyword arguments for configuring title appearance using matplotlib.pyplot.title. Default is an empty dictionary. • figsize (tuple): Dimensions of the figure. Default is (15, 15). • facecolor (str): Background color of the figure. Default is “white”. • edgecolor (str): Color of the map’s edges. Default is “black”. • linewidth (float): Line width for shapes. Default is 0.5. • color (str): Color of the shape. Default is “#F1F3F4”. • annot (bool): Toggle annotations on/off. Default is False. • annot_column (str/GeoDataFrame column): Source column for annotations. Default is None. • annot_align (str): Text alignment for annotations. Default is “center”. • annot_kwds (dict): Keyword arguments for customizing annotations. Default is an empty dictionary. • ax (matplotlib axis): Existing axis for plotting, if needed. Default is None. • axis_on (bool): Toggle axis visibility. Default is False. • **geopandas_plot_kwds: Additional keyword arguments for Geopandas plot customization.</p><p id="5a62">Returns: Matplotlib axis object (ax) representing the map.</p><p id="39a4">This function enables straightforward GeoDataFrame shape plotting with customizable options for appearance and annotations, while allowing flexibility in using existing axes for plotting. The function returns a matplotlib axis object representing the generated map.</p><h1 id="7308">pointplot</h1><p id="e010">Point plot is designed specifically for visualizing point data. A key distinction between point plot and shapeplot lies in the ability to utilize a base vector layer of shapes. This base layer allows points to be plotted on top, enabling a layered representation.</p><div id="62be"><pre>usa_points = usa.representative_point() gsp.pointplot(usa_points, <span class="hljs-keyword">base</span>=usa)</pre></div><figure id="e5d7"><img src="https://cdn-images-1.readmedium.com/v2/resize:fit:800/1*ZOiYi_T2DL9CU9Kx7-KpGA.png"><figcaption></figcaption></figure><p id="6b86">Alternatively, you have the option to plot the polygons themselves instead of just their boundaries in the base layer.</p><div id="aac0"><pre>gsp.pointplot(usa_points, <span class="hljs-keyword">base</span>=usa, base_boundary=False)</pre></div><figure id="3412"><img src="https://cdn-images-1.readmedium.com/v2/resize:fit:800/1*_Sz_IGkazfobhvTpV3Y8Ag.png"><figcaption></figcaption></figure><p id="8f2e">Points can be plotted independently, without the need for a base layer.</p><div id="30aa"><pre>gsp<span class="hljs-selector-class">.pointplot</span>(usa_points)</pre></div><figure id="d8ed"><img src="https://cdn

Options

-images-1.readmedium.com/v2/resize:fit:800/1*zFOL9eUsmS-5S67MeufNcQ.png"><figcaption></figcaption></figure><p id="5c42">Matplotlib axis objects offer the ability to merge and combine multiple plots.</p><div id="4753"><pre>ax = gsp.shapeplot(usa, figsize=(<span class="hljs-number">15</span>, <span class="hljs-number">15</span>)) gsp.pointplot(usa_points, ax=ax)</pre></div><figure id="f05f"><img src="https://cdn-images-1.readmedium.com/v2/resize:fit:800/1*_Sz_IGkazfobhvTpV3Y8Ag.png"><figcaption></figcaption></figure><p id="b9e0">It’s also possible to tailor the appearance of the base layer according to your preferences.</p><div id="3dfa"><pre>gsp.pointplot( usa_points, base=usa, basecolor=<span class="hljs-string">"#7aebff"</span>, base_boundary=<span class="hljs-literal">False</span>, title=<span class="hljs-string">"USA Points"</span>, title_kwds={<span class="hljs-string">"fontsize"</span>: <span class="hljs-number">25</span>, <span class="hljs-string">"fontname"</span>: <span class="hljs-string">"sans-serif"</span>, <span class="hljs-string">"fontweight"</span>: <span class="hljs-number">3</span>}, )</pre></div><figure id="ce5a"><img src="https://cdn-images-1.readmedium.com/v2/resize:fit:800/1*AiPv5roDBIrvCc92oIvZ4g.png"><figcaption></figcaption></figure><p id="3d19"><b>Here’s the breakdown of the pointplot function’s parameters:</b></p><p id="a875">• data (GeoDataFrame): The GeoDataFrame used for plotting the map. • base (GeoDataFrame): Base GeoDataFrame on top of which the data will be plotted. Defaults to None. • title (str): Title of the map. Defaults to None. • title_kwds (dict): Keyword arguments for configuring the appearance of the title using matplotlib.pyplot.title. Defaults to an empty dictionary. • figsize (tuple): Size of the figure. Defaults to (15, 15). • color (str): Color of the point. Defaults to “#ffb536”. • edgecolor (str): Color of the map’s edges. Defaults to “black”. • basecolor (str): Color of the base data. Defaults to “#F1F3F4”. • baseboundarycolor (str): Boundary color of the base data. Defaults to “black”. • base_boundary (bool): Toggle visibility of base data boundaries. Defaults to True. • boundary_linewidth (float): Linewidth of the base data boundaries. Defaults to 0.5. • linewidth (float): Width of lines for shapes. Defaults to 0.5. • annot (bool): If True, annotations are generated. Defaults to False. • annot_column (str/GeoDataFrame column): If annot is True, column should be passed as the source for annotation. Defaults to None. • annot_align (str): Text alignment for annotations. Defaults to “center”. • annot_kwds (dict): Keyword arguments for annotation customization. Defaults to an empty dictionary. • ax (matplotlib axis): Existing axis for plotting. Defaults to None. • axis_on (bool): Toggle axis visibility. Defaults to False. • facecolor (str): Figure’s face color. Defaults to “white”. • **geopandas_plot_kwds: Additional Geopandas plot keyword arguments.</p><p id="fd44">Returns: Matplotlib axis object (ax).</p><h1 id="44de">Tips for Polished Maps</h1><p id="46bb"><b>Harmonious Color Choices:</b> Experiment with color palettes to create maps that are visually pleasing and easy to understand. Choose colors that enhance the readability of your map.</p><p id="6be4"><b>Precise Annotations:</b> Annotations provide context to your maps. Customize annotation alignment and appearance to guide viewers through your spatial narrative seamlessly.</p><p id="b235"><b>Seamless Matplotlib Integration:</b> Leverage the integration with Matplotlib to fine-tune your maps’ aesthetics, titles, and labels for a polished final product.</p><h1 id="071e">Conclusion</h1><p id="3df6">In this tutorial, we’ve covered the essentials of crafting geospatial maps using the gspatial_plot library. With gspatial_plot, the process of geospatial mapping becomes more manageable and easy. See you in the next tutorial— happy mapping!</p></article></body>

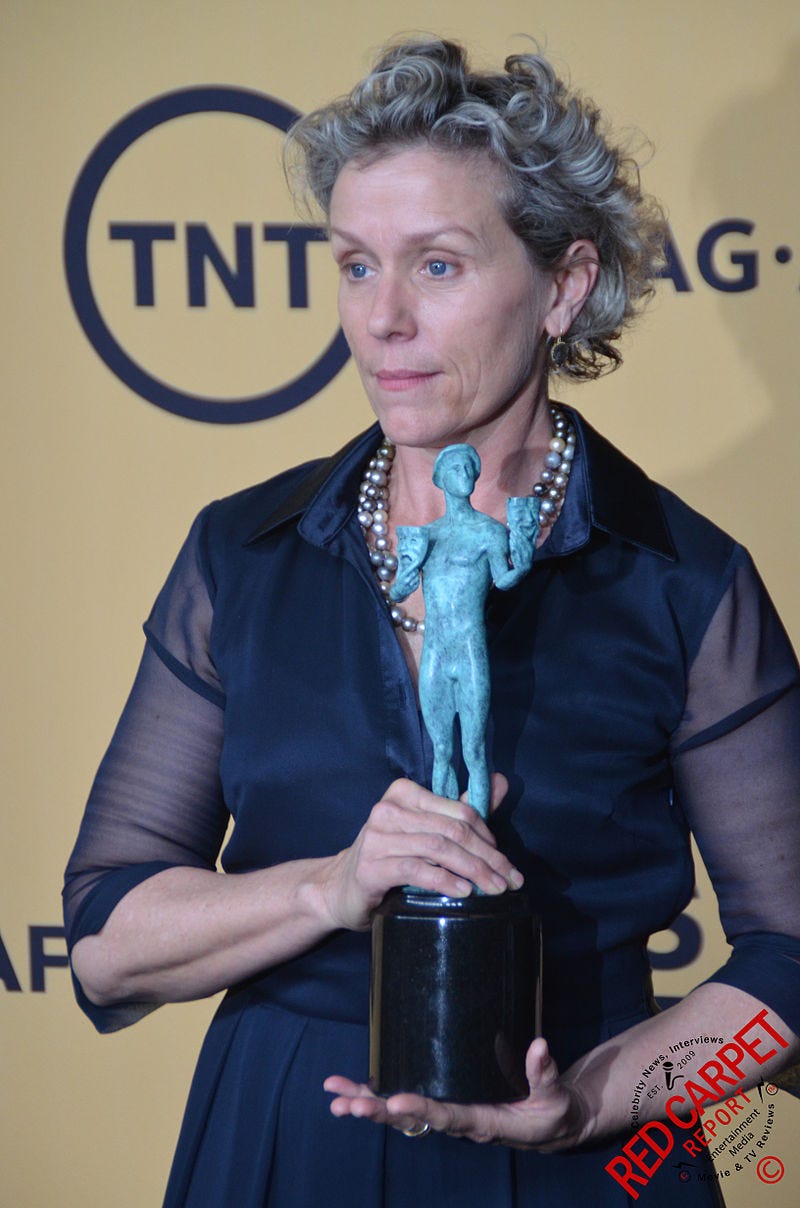
I love Award-Winning Actress Frances McDormand for Her Many Talents and How She Models Graceful Aging

Let me emulate her with as much acceptance and dignity as I can

Frances McDormand: the Creative Commons Attribution-Share Alike 2.0 Generic license.

At this stage of my life, I’m on the lookout for role models for aging gracefully.

Given the Oscars are coming right up, and Frances McDormand is up for a Best Actress award, I’m starting with her.

Besides, speaking out against agism, she’s one helluva great actress.

In my opinion, that’s because she studied theater and acted on the stage, including Broadway, as well as the big and small screens. There’s something about theater that adds texture and depth to a performance.

Maybe because theater is live.

Chemistry happens when actors connect with their audience, exchanging waves of energy back and forth during the performance. Ms. McDermond puts it like this:

I’m trained in the theater, and acting, for me, is about the imaginative life I create for myself, not about basing it on something real. I think that whatever I create becomes the reality for the audience.

Not only that, there’s no magnification like there is on film or TV. So it’s up to the actor to project their characters through everything they do with their bodies, their voices, and their use of language. That includes knowing when to keep still and silent–one of the most dramatic things you can do on a stage.

And one more point about live performances. There’s only one ‘take.’ No do-overs or reshooting the scene. It’s all done in one hopefully seamless flow. Intermission is the only break.

All of this is why stage actors do so well on film and television.

Frances McDermond is one such amazing talent.

Known for her award-winning performances as the pregnant police chief, Marge Gunderson in Fargo, a depressed aging teacher in Olive Kitteridge in the TV min-series, and as Mildred Hayes, a mother grieving the rape and murder of her daughter in Three Billboards Outside Ebbing, Missouri.

These are just a small fraction of her performances. In 2021 she won Best Actress for her role as Fern in Nomadland. And this year she’s up again for transforming herself into the blood-stained diva of death, Lady McBeth of out, out damned spot fame in The Tragedy of Macbeth.

All this and more from a woman who identifies as ‘white trash.’

In her words: My name is Frances Louise McDormand, formerly known as Cynthia Ann Smith. I was born in Gibson City, Ill., in 1957. I identify as gender-normative, heterosexual, and white-trash American. My parents were not white trash. My birth mother was white trash.

Despite her long list of nominations and awards, Ms. McDormand does not consider herself a movie star. She takes pride in being an actor, often cast in a supporting role–roles she shines in and makes pop, given her talent and versatility.

Having a rubber face helps her transform into all these people who have nothing in common except her infusing them with life. She excels at playing average-looking, sounding people who end up doing extraordinary things.

Here’s her take on that:

I’ve got a rubber face. It has always served me very well and really helps, especially as I get older, because I still have all my road map intact, and I can use it at will.

I was often told that I wasn’t a thing. ‘She’s not pretty enough. She’s not tall enough. She’s not fat enough. I thought, ‘OK, someday you’re going to be looking for someone not, not, not, not, and there I’ll be.

She plays those ‘not, not’ characters so well, people think she is who she plays:

After Blood Simple, everybody thought I was from Texas. After Mississippi Burning, everybody thought I was from Mississippi and uneducated. After Fargo, everybody’s going to think I’m from Minnesota, pregnant, and have blonde hair. I don’t think you can ever completely transform yourself on film, but if you do your job well, you can make people believe that you’re the character you’re trying to be.”

Using Influence to Advocate

Being that convincing gives an actor power and influence over how that kind of person is seen by potentially millions of people. About this, McDormand says:

I portray female characters, so I have the opportunity to change the way people look at them. Even if I wasn’t consciously doing that, it would happen anyway just because of how I present as a woman, or as a person. I present in a way that’s not stereotypical, even if I’m playing a stereotypical role.

Not just Women, but how We View and Handle Aging

First of all, Francis McDormand does not alter her appearance or chase after a more youthful look the way some actors and movie stars do. If anything, she wears her age and experience as a badge of honor:

The way people age and the signs that we show of aging is nature’s way of tattooing. It’s natural scarification, and the life you lead gives you the symbols and the emblems of your life, the road map you followed.

I’m not the only one choosing her to role model aging gracefully. Frances McDormand puts herself out there in that role:

I need to represent publicly what I’ve chosen to represent privately — which is a woman who is proud and more powerful than I was when I was younger. And I think that I carry that pride and power on my face and in my body.

Carrying pride and power in our faces and bodies! I like the sound of that.

Though for me, the issue is less about what I look like and more about how I feel and what I’m able to do. I consider all of that part of aging gracefully. I think she does too, based on statements like these shared in an interview on National Public Radio:

Getting older and adjusting to all the things that biologically happen to you is not easy to do, and is a constant struggle and adjustment. I have some things to talk about and say and help.

So Good to Hear!

And yet I wonder if it would be as hard as it is if our society were not more open and accepting and supportive, right? Ms. McDormand speaks to this as well:

I’m interested in starting the conversation about aging gracefully and how, instead of making it a cultural problem, we make it individuals’ problems. I think that ageism is a cultural illness; it’s not a personal illness.

She inspires me to feel proud and powerful every time I look in my bathroom mirror. And in those moments where that’s a challenge, let me remember her words:

I want to be an elder; I want to be an elderess. I want to be revered.

Request granted.

We can all revere and root for Frances McDormand at the Oscars this coming Sunday, March 27th. Here’s a glimpse of the Lady herself, teamed up with co-star, Denzel Washington, and her husband/director, Joel Coen, discussed in this engaging ‘Making Of’ video:

What are you ‘too old’ or ‘too scared’ to do? Let me show you how!

Marilyn Flower writes humor to laugh the changes she wants to see and make. She’s the author of Creative Blogging: Ninja Writers Guide to Character Development and Bucket Listers, Get Your Brave On: How to Do the Thing You’re ‘Too Old’ & ‘Too Scared’ to Do. Clowning and improvisation strengthen her resolve during these crazy times. Follow my Sacred Foolishness and Stay in touch!

Wisdom
Middle Pause
Frances Mcdormand
Aging
Oscars
Recommended from ReadMedium