
I Found One Of The Best Trading Strategies with Python
Backtesting a conditions-based trading strategy on Tesla with python.
Investing and trading during turbulent times are really tough. I find it challenging to predict which stocks or cryptos will perform well and which will underperform when the markets are swinging that wildly. However, I am researching quant and rules-driven strategies all the time. This way I am able to do the extra mile in proving statistically that something would work before I allocate money to it. By the way, an algorithmic trading strategy is still an investment, right? 🤓
It is much easier to do a 100% return on a 100k portfolio than 10% on a 10 billion portfolio.
We have to be careful when we research trading strategies and always take into account transaction costs and liquidity (bid/ask spreads) because these two factors alone can turn a profitable strategy into a losing one. But if you don’t want to take them into account because it would involve too much complexity, just research a highly liquid stock! That’s why I chose to research a strategy on the Tesla stock today, as it is one of the most liquid stocks over the last 3 years, if not the most liquid. And it turns out that very simple and straightforward strategies can work pretty well. Alright, Let’s get into it!
Project Key Features
- Download Tesla daily stock price.
- Calculate Stochastic RSI and Bollinger Bands indicators.
- Estimate the Long/Short signals with a holding period of 3 days after the signal.
- Visualize the cumulative returns of this strategy.
This is a pretty simple strategy.
Let’s get into it!
1. Load packages, download data and calculate indicators.
import pandas_ta
import pandas as pd
import numpy as np
import matplotlib.pyplot as plt
import yfinance as yf
import datetime as dt
import matplotlib.dates as mdates

prices_df = yf.download(tickers='TSLA',
                        start='2019-01-01',
                        end=dt.date.today())

prices_df['stoch_k'] = pandas_ta.stochrsi(close=prices_df['Adj Close'],
                                          length=20).iloc[:,0]

prices_df['stoch_d'] = pandas_ta.stochrsi(close=prices_df['Adj Close'],
                                          length=20).iloc[:,1]

prices_df['bb_lower'] = pandas_ta.bbands(close=prices_df['Adj Close'],
                                         length=20).iloc[:,0]

prices_df['bb_upper'] = pandas_ta.bbands(close=prices_df['Adj Close'],
                                         length=20).iloc[:,2]

prices_df['forward_1d'] = prices_df['Adj Close'].pct_change(1).shift(-1)

prices_df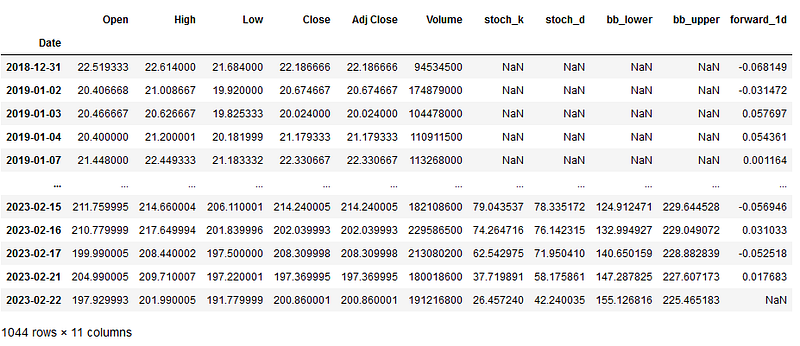
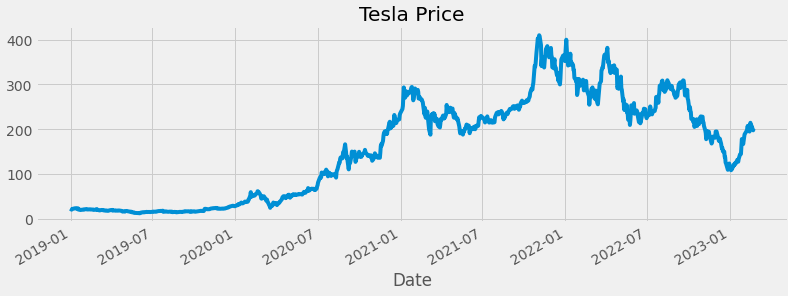
Sharpe Ratio of Buy and Hold Tesla: 1.13
2. Strategy Formation And Backtesting.
In this strategy we want the following:
- If the (Close Price > Upper Bollinger Band) AND (Stoch RSI K line > Stoch RSI D line) we get a LONG signal.
- If the (Close Price < Upper Bollinger Band) AND (Stoch RSI K line < Stoch RSI D line) we get a SHORT signal.
After we get a signal the holding period is 3 days.
In my experience, the combination of volatility indicators like Bollinger Bands and momentum indicators like Stochastic RSI can produce a wonderful combination!
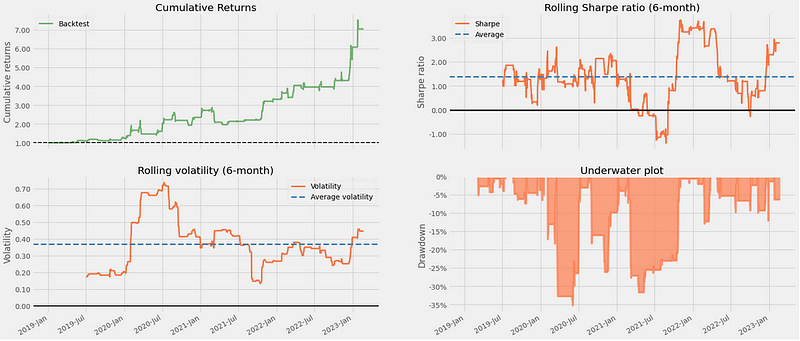
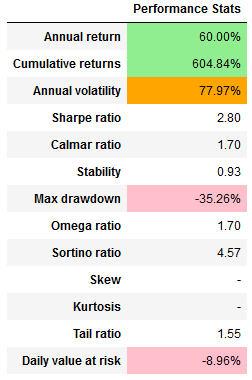
Sharpe Ratio of Strategy: 2.79
So we can clearly see that there is something going on here, and now I am happy and much more confident in my decisions for sure.😁 I will leave the conclusions for you if it is worth the effort in applying a strict rules-based approach to markets and carefully backtesting any idea.
This strategy looks good, but as most of you probably know, we shouldn’t chase past returns, but then how are we supposed to find good opportunities without backtesting on the past… We can easily get into an endless tailspin if we follow this logic.
That’s why I prefer to find really good-looking strategies put them to work really fast, and then immediately start looking and searching for the next one! Because in our era of abundant information strategies get arbitraged away rather quickly! You need to always be sniffing for the next one 🐽🐽
Conclusion
In this article, we explored a straightforward and easy-to-replicate strategy on the Tesla stock. We touched on the topic of combining momentum and volatility indicators, and how that can give us good results! Furthermore, we dug deep into the results of our current strategy.
I hope this article is helpful! Let me know if you have any questions or if you would like further information on any of the topics covered.
A Message from QuantFactory:

Thank you for being part of our community! Before you go:
- Master Algorithmic Trading with Python👉 here.
- Join our Premium Discord Server👉 here.
- Subscribe to our Exclusive Stocks Newsletter 👉 here.
- If you liked the story feel free to clap 👏 and follow the author.
- For more stories from the Algorithmic Trading and Quantitative Analysis world you should follow the Quant Factory Publication.
*Note that this article does not provide personal investment advice and I am not a qualified licensed investment advisor. All information found here is for entertainment or educational purposes only and should not be construed as personal investment advice.


