I Built an Online Automated Dashboard Displaying Canada’s CPI and Economic Indicators
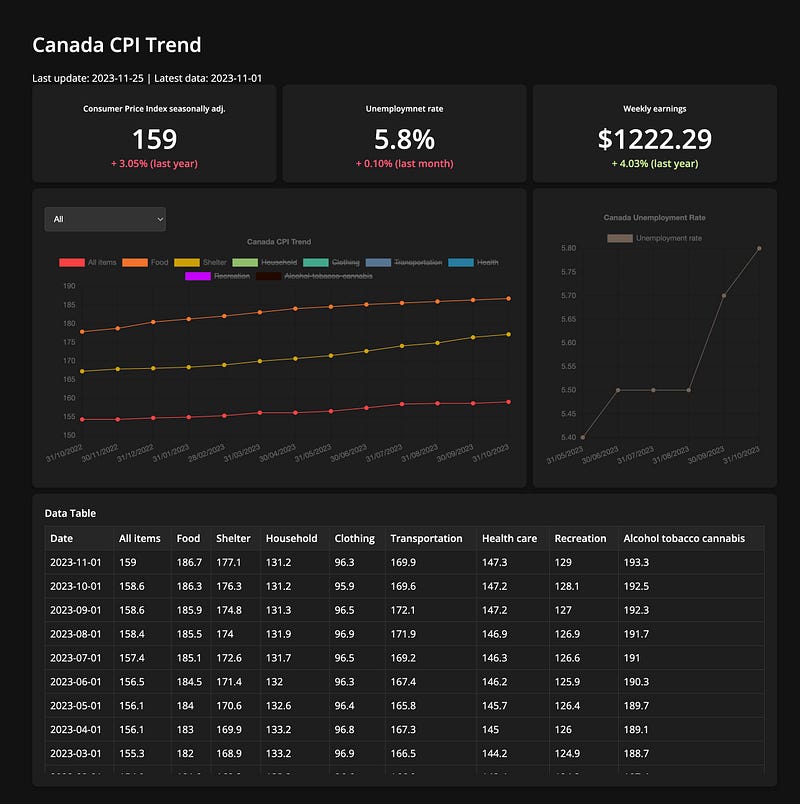
I built a website that automatically tracks and report data from Stats Canada, go check out the page https://andy3278.github.io/Canada-Monthly-CPI/
Why I built this
While Statistics Canada offers a wealth of data capable of providing significant insights, I realized the challenge in simultaneously accessing and interpreting multiple datasets.
Also, the need for a unified view where charts and data coexist on a single page was evident. Driven by this, my objective was to create a streamlined website that consolidates key economic KPIs in one easily accessible location. This site aims to simplify the user experience, bringing together important economic indicators like the CPI and unemployment rates, and presenting them in an engaging, interactive format.
Data
All the data for this project is sourced from Statistic Canada, focusing on:
- Consumer Price Index, monthly, seasonally adjusted
- Labour force characteristics, monthly, seasonally adjusted and trend-cycle, last 5 months
- Employment, average hourly and weekly earnings
I utilized the Python library stats-can, which simplifies the process of turning Statistics Canada tables or vectors into Pandas dataframes. For this project, I only need a few specific indicators, which meant I needed just a handful of vectors.
Here’s how I extracted the data:
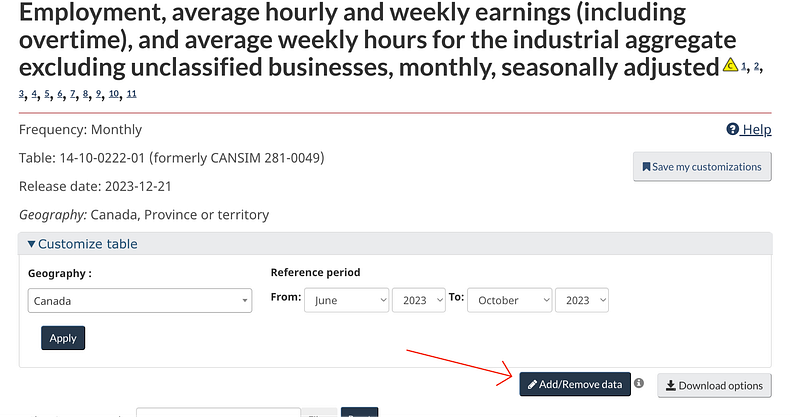
go to Statistic Canada and search for data then use “Add/Remove data” options.
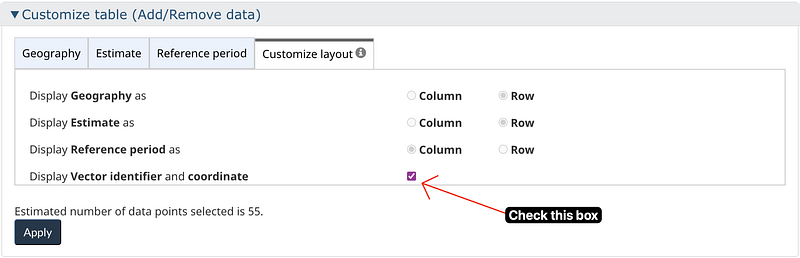
And check the “Display Vecor Identifier and coordinate” box, this will show the vector of our target data.
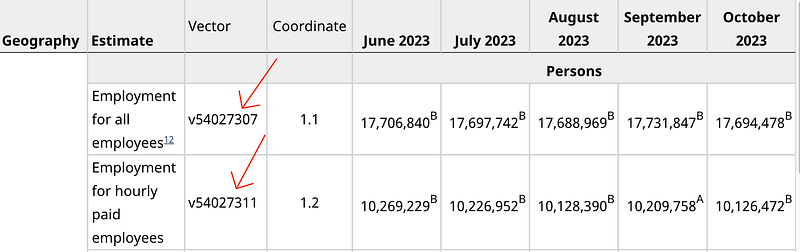
we can use python library stats-can and the vectors to extract data.
import stats_can
import pandas as pd

df = stats_can.sc.vectors_to_df("v54027306", periods= target_months)
df.rename(columns={"v54027306": "Average weekly earnings"}, inplace=True)
df.index.names = ['Date']
df.reset_index(inplace=True)
df.to_csv("./docs/data/Canada_earnings.csv")

# this is what the data looks like in csv
,Date,Average weekly earnings
0,2022-10-01,1174.95
1,2022-11-01,1179.75
2,2022-12-01,1167.79
3,2023-01-01,1181.9
4,2023-02-01,1177.29
5,2023-03-01,1189.09
6,2023-04-01,1195.6
7,2023-05-01,1200.27
8,2023-06-01,1204.88
9,2023-07-01,1214.03
10,2023-08-01,1214.94
11,2023-09-01,1218.07
12,2023-10-01,1222.29
Automation
Since most of the data on Statistic Canada is updated monthly, I need my python script to also run monthly to get the latest data. There are many ways to achieve this.
- GitHub Actions
- Task Scheduler (Windows only)
- Cloud-Based Solutions (AWS, Azure and Google Cloud)
- Python Libraries (
scheduleorAPScheduler)
For this project, I chose GitHub Actions, considering the data updates are monthly and the volume isn’t overwhelming. Setting up an Action is straightforward:
- Create a
.githubfolder, then aworkflowsfolder within it, and finally add anaction.ymlfile. - In the YAML file, specify when and how the script should execute. I used crontab.guru to set up the time and frequency.
- Note these important points:
- If your Python script imports libraries, include a
requirements.txtfile. - If your script makes changes to your repository, add commit and push commands to your YAML file.
- If your script commits and pushes changes, adjust your repository settings to grant read and write permissions.
name: run main.py

on:
  #workflow_dispatch:
  schedule:
    - cron: '00 15 25 * *' # At 15:00 on day-of-month 25

jobs:
  build:
    runs-on: ubuntu-latest
    steps:

      - name: checkout repo content
        uses: actions/checkout@v3 # checkout the repository content to github runner

      - name: setup python
        uses: actions/setup-python@v4
        with:
          python-version: '3.9' # install the python version needed

      - name: install python packages
        run: |
          python -m pip install --upgrade pip
          pip install -r requirements.txt

      - name: execute py script # run main.py
        run: python main.py

      - name: commit files
        run: |
          git config --local user.email "[email protected]"
          git config --local user.name "GitHub Action"
          git add -A
          git diff-index --quiet HEAD || (git commit -a -m "updated logs" --allow-empty)

      - name: push changes
        uses: ad-m/[email protected]
        with:
          github_token: ${{ secrets.GITHUB_TOKEN }}
branch: main 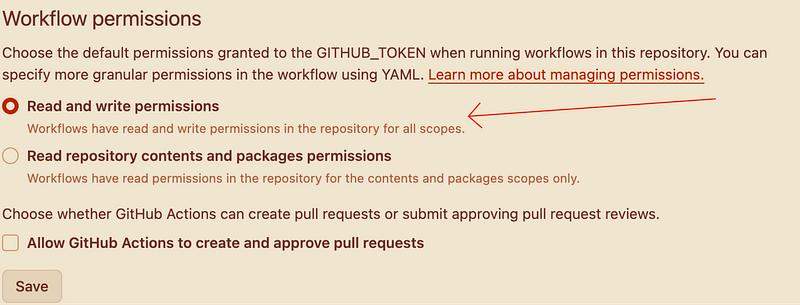
Website
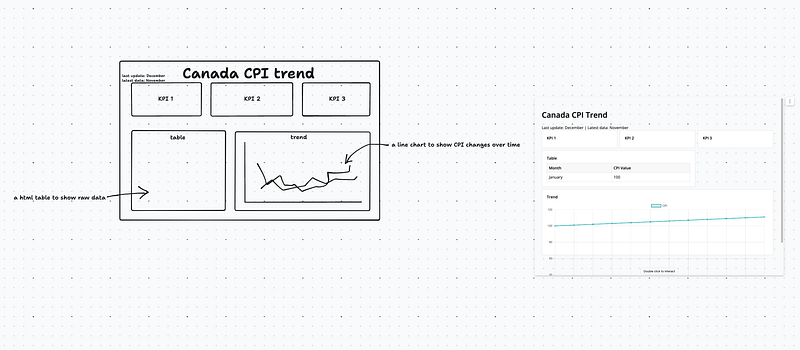
While I’m not quite familiar with modern web dev, I managed to create the website using basic HTML, JavaScript, and CSS, with huge assistance from AI. For the UI and layout, I utilized a tool called makereal tldraw which leverages GPT-4V (V for Vision) to code basic design elements. This was particularly helpful for someone like me, who is less comfortable with web development. I can draw the website I think of and leave the rest to GPT-4V.
If you’re hearing about this type of AI-assisted web development service for the first time, I’ve written an article discussing how ‘makereal tldraw’ works and the benefits it offers. It’s an amazing tool, especially for those who want to build a web presence without deep diving into advanced coding. Feel free to check my article.
https://readmedium.com/i-draw-a-ui-layout-and-this-tool-turn-it-to-website-41dd167af3ee
Conclusion
This project is a great experience of data extraction, web development, and automation. Interacting with GitHub Actions for the first time, I found it remarkably user-friendly (if you are a GitHub user). The fact that everything is controlled through a YAML file made the management straightforward and efficient. Working on this project has deepened my appreciation for economic data, as it represents real-life impacts on individuals and society. I look forward to exploring more opportunities where data meets real-world application.
That’s all for me this year! Good bye 2023, keep coding, keep writing in 2024