
I Backtested The Turtle Strategy And Got Surprised By The 250k$ Profit
The Turtle Trading strategy is a trend-following strategy that was developed by Richard Dennis and William Eckhardt. The strategy is based on a set of rules that determine when to enter and exit a trade based on the price action of an asset. The strategy is known for its simplicity and its ability to generate profits over the long term.

The core idea of the Turtle Trading strategy is to identify the direction of the trend and enter a trade in that direction. The strategy uses two moving averages to determine the trend direction: a long-term moving average and a short-term moving average. When the short-term moving average crosses above the long-term moving average, it’s a signal to buy the asset. When the short-term moving average crosses below the long-term moving average, it’s a signal to sell the asset.
Now, let’s look at the Python code that implements the Turtle Trading strategy. The first two lines of the code calculate the two moving averages:
df['SMA1']=((ta.trend.sma_indicator(close=df['close'], window=55,fillna= True)) )
df['SMA2']=((ta.trend.sma_indicator(close=df['close'], window=20,fillna= True)) )
Here, we are using the sma_indicator() function from the ta (technical analysis) library to calculate the simple moving averages (SMAs) of the closing prices. The first moving average has a window of 55 days, while the second moving average has a window of 20 days.
Next, we use a loop to iterate over each row in the DataFrame and generate the trading signals based on the position of the closing price relative to the moving averages:
signals.append(0)
for i in range(1, len(df)-1):
    # Your trading strategy goes here
    # For example, you could use a simple moving average crossover strategy
    if df.iloc[i]['close'] > df.iloc[i]['SMA1'] :
        signals.append(-1)
    elif df.iloc[i]['close'] < df.iloc[i]['SMA2'] :
        signals.append(1)
    else :
        signals.append(0)
signals.append(0)
If the closing price is above the longer-term moving average, we append a signal of -1 to the signals list, which indicates a sell signal. If the closing price is below the shorter-term moving average, we append a signal of 1, which indicates a buy signal. If the closing price is between the two moving averages, we append a signal of 0, which indicates that no trade should be taken.
Once we have generated the trading signals, we use another loop to simulate the trades and calculate the profits:
df["signal"] = signals
print(signals)
investment = 1000
current_investment = 1000
invested_amount = 0
fees = 0
profit = 0
is_invested = False
best_trade = -99999999
worst_trade = 99999999
largest_loss = 0
largest_gain = 0
total_trades = 0
loss_threshold = 0.03 # Stop loss threshold at 5% loss
loss_amount = 0 # variable to track loss amount

for i in range(500, len(df)):
    signal = df.iloc[i]['signal']
    close = df.iloc[i]['close']

    if signal == 1 and not is_invested:
        Entrypoint = close
        print(signal)
        print(close)
        quantity = (current_investment / close)
        print(current_investment)
        print(quantity)
        invested_amount = quantity * close
        is_invested = True
    elif signal == -1 and is_invested:
        print(signal)
        print('close', close)
        profit = quantity * (  close - Entrypoint) - 2
        print('profit' ,profit)
        current_investment += profit
        invested_amount = 0
        total_trades += 1
        is_invested = False
        if profit > largest_gain:
            largest_gain = profit
        if profit < largest_loss:
            largest_loss = profit
        if profit > best_trade:
            best_trade = profit
        if profit < worst_trade:
            worst_trade = profit
        loss_amount = 0 # reset loss_amount when position is closed
    elif is_invested:
        # check if stop loss threshold has been reached
        loss = invested_amount - (quantity * close)
        if loss > invested_amount * loss_threshold:
            print("Stop loss triggered!")
            profit = invested_amount * (1 - loss_threshold) - invested_amount - 2
            current_investment += profit
            invested_amount = 0
            total_trades += 1
            is_invested = False
            if profit > largest_gain:
                largest_gain = profit
            if profit < largest_loss:
                largest_loss = profit
            if profit > best_trade:
                best_trade = profit
            if profit < worst_trade:
                worst_trade = profit
            loss_amount = 0 # reset loss_amount when position is closed
        else:
            loss_amount = loss # update loss_amount
    else:
        pass

final_profit = current_investment - investment
print("Final Profit: ", final_profit)
print("Best Trade: ", best_trade)
print("Worst Trade: ", worst_trade)
print("Largest Loss: ", largest_loss)
print("Largest Gain: ", largest_gain)
print("Total Trades: ", total_trades)
After running the backtest in 1h timeframe in ETHUSDT, we can see the results:
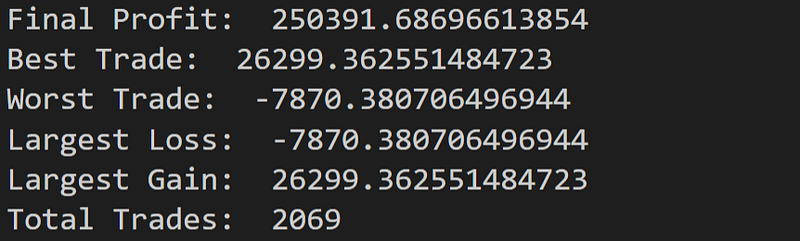
The backtest shows a total profit of $250,391 with 2069 trades. The best trade resulted in a profit of $26299, while the worst trade resulted in a loss of $7870.
While these results are impressive, it’s important to note that past performance does not guarantee future results. The Turtle Trading Strategy has been successful in the past, but it may not be profitable in the future. Additionally, the backtest does not account for slippage, trading fees, or other market conditions that can affect profitability.
The backtest results show that the strategy has performed well on the given dataset, generating a profit of $250,000 over a period of time. However, it is important to keep in mind that past performance does not guarantee future results and the strategy may perform differently on other datasets or in different market conditions.
As with any trading strategy, it is important to thoroughly test and optimize the parameters on a range of data sets to ensure the strategy is robust and effective. It is also important to manage risk effectively by using stop losses, position sizing, and other risk management techniques to minimize losses and maximize profits.
Overall, the Turtle Trading Strategy is a useful and effective strategy for traders looking to follow trends and capture profits in the markets. By combining technical analysis and sound risk management principles, traders can use this strategy to generate consistent profits over the long term.
A Message from InsiderFinance

Thanks for being a part of our community! Before you go:
- 👏 Clap for the story and follow the author 👉
- 📰 View more content in the InsiderFinance Wire
- 📚 Take our FREE Masterclass
- 📈 Discover Powerful Trading Tools


