
Hystrix Dashboard + Turbine Stream Aggregator
by Ben Christensen, Puneet Oberai and Ben Schmaus
Two weeks ago we introduced Hystrix, a library for engineering resilience into distributed systems. Today we’re open sourcing the Hystrix dashboard application, as well as a new companion project called Turbine that provides low latency event stream aggregation.
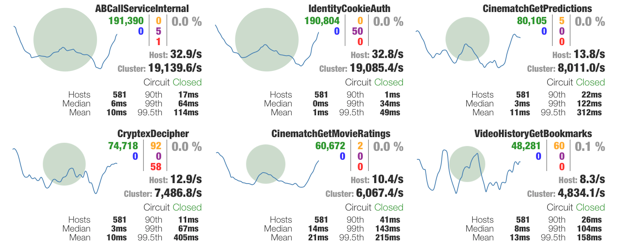
The Hystrix dashboard has significantly improved our operations by reducing discovery and recovery times during operational events. The duration of most production incidents (already less frequent due to Hystrix) is far shorter, with diminished impact, because we are now able to get realtime insights (1–2 second latency) into system behavior. The following snapshot shows six HystrixCommands being used by the Netflix API. Under the hood of this example dashboard, Turbine is aggregating data from 581 servers into a single stream of metrics supporting the dashboard application, which in turn streams the aggregated data to the browser for display in the UI.
When a circuit is failing then it changes colors (gradient from green through yellow, orange and red) such as this:

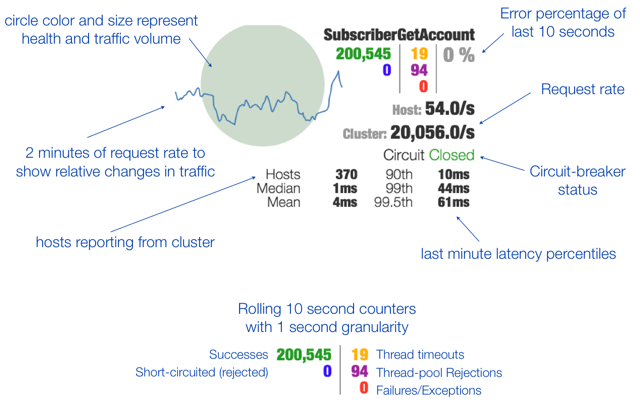
The diagram below shows one “circuit” from the dashboard along with explanations of what all of the data represents. We’ve purposefully tried to pack a lot of information into the dashboard so that engineers can quickly consume and correlate data.
The following video shows the dashboard operating with data from a Netflix API cluster:
The Turbine deployment at Netflix connects to thousands of Hystrix-enabled servers and aggregates realtime streams from them. Netflix uses Turbine with a Eureka plugin that handles instances joining and leaving clusters (due to autoscaling, red/black deployments, or just being unhealthy).
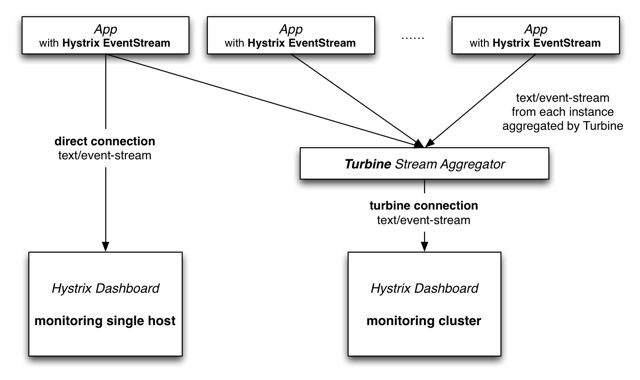
Our alerting systems have also started migrating to Turbine-powered metrics streams so that in one minute of data there are dozens or hundreds of points of data for a single metric. This high resolution of metrics data makes for better and faster alerting. The Hystrix dashboard can be used either to monitor an individual instance without Turbine or in conjunction with Turbine to monitor multi-machine clusters:
Turbine can be found on Github at: https://github.com/Netflix/Turbine
Dashboard documentation is at: https://github.com/Netflix/Hystrix/wiki/Dashboard
We expect people to want to customize the UI so the javascript modules have been implemented in a way that they can easily be used standalone in existing dashboards and applications. We also expect different perspectives on how to visualize and represent data and look forward to contributions back to both Hystrix and Turbine.
We are always looking for talented engineers so if you’re interested in this type of work contact us via jobs.netflix.com.
See Also:
Originally published at techblog.netflix.com on December 11, 2012.


