
How you can use Python to find the top ten momentum stocks quickly and efficiently

Here is a step by step guide to a process I run each month to choose my next potential momentum¹ based investments. Of course, this is not investment advice, and I'm not guaranteeing you will make any money. Still, it demonstrates how quick and easy it can be to automate share price information gathering and analysis — No wading through adverts and cookies — No cutting and pasting!. The process was born out of frustration that I could not find a simple, reliable league table of the fastest-growing shares in an online sea of information. The code below will run online in a Google Colaboratory notebook². So, you can get away with not knowing or caring how to run a Python environment — scroll to the end, find the open in colab link and run the code— everything will update with the latest data — and that's it.
If you have not used Python to analyse data before — welcome to the new World! And it's now possible to do all this online without having a high powered computer or spending hours downloading and configuring software¹⁰. If I am preaching to the converted and you know what Jupyter notebooks are, you can download and run this one from my Github⁹.
The first job, find out what stocks are available to trade
I use Freetrade as a broker; at the time of writing, the Freetrade stock list was on this page. And the data itself is stored in a spreadsheet
Of course, these links may change; therefore, edit the link in the code if it is broken. Or, if you use a different broker, find their listings. The goal here is to have a list of stocks symbols to evaluate!
# import the Python modules and packages required
import pandas as pd
import numpy as np
import io
import requests
import pprint
import matplotlib.pyplot as plt
The link is for a multitab Google docs spreadsheet. However, we only need one tab so, there is a bit of work to adjust the link and get only the one sheet³.
# the freetrade file link
link = "https://docs.google.com/spreadsheets/d/14Ep-CmoqWxrMU8HshxthRcdRW8IsXvh3n2-ZHVCzqzQ/edit#gid=1855920257"
# split the link after /edit - keep just the first part
url_start = link.split('/edit')[0]# add the sheet name
sheet_name = 'Freetrade Universe'
url_end = f"/gviz/tq?tqx=out:csv&sheet={sheet_name}"# build the new link
url = url_start + url_end
# show the new url
url'https://docs.google.com/spreadsheets/d/14Ep-CmoqWxrMU8HshxthRcdRW8IsXvh3n2-ZHVCzqzQ/gviz/tq?tqx=out:csv&sheet=Freetrade Universe'The Python Requests⁴ library makes it easy to grab data from websites, so we will use that to get the spreadsheet URL and Pythons' StringIO⁵ to knock the data into a readable format⁶.
# use python requests package to get the file
file = requests.get(url).content
# use python io to read the file into a pandas dataframe
df = pd.read_csv(io.StringIO(file.decode('utf-8')))# view the first 5 lines
df.head()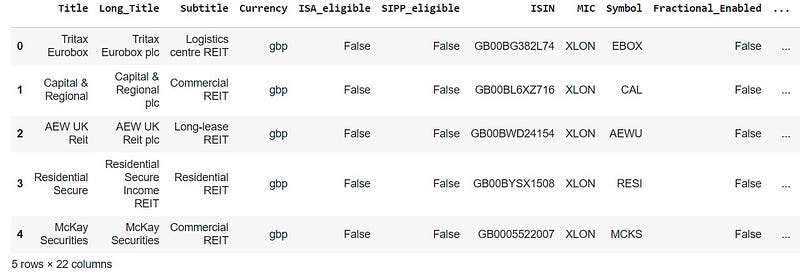
Next, filter the data frame of stocks for your account circumstances
When you look at the columns in the data, there are some boolean (True/False) columns to filter the stocks, e.g. my investments are held in a UK ISA for tax efficiency, I am not a Plus subscriber, and I like being able to buy Fractional shares. So I need to choose only the True rows to filter the number of shares as follows.
# how many shares are there to start with?
print('Number of shares available: ',len(df))
Number of shares available: 5566# choose only the ISA eligible ones
df = df[df['ISA_eligible']==True]
# whats left?
print('Number of shares available: ',len(df))Number of shares available: 5135# deselect the Plus account only shares
df = df[df['PLUS_only']==False]
print('Number of shares available: ',len(df))Number of shares available: 4026# make sure they can be traded fractionally
df = df[df['Fractional_Enabled']==True]
print('Number of available: ',len(df))Number of available: 3389Now clean up the spreadsheet.
Drop the other columns and keep a few useful ones for reference information.
- ISIN — this is a unique identifier for all stocks Worldwide
- MIC — this is an identifier for the exchange the stocks are traded on
- Subtitle — looks like the market sector
- Symbol is the market ticker
- The title, long title and account currency
# Copy to a new dataframe and keep only the useful columns
tradeable = df[['Title', 'Long_Title', 'Subtitle', 'Currency',         'ISIN', 'MIC', 'Symbol']].copy()
Time to get the share price data from the internet?
Many sites provide comprehensive share price data; we can use Python to painlessly grab and collate this data from the internet. First stop Yahoo Finance⁷, and there is a Python module to work with that data called yfinance⁸. yfinance does not come preinstalled in google colab notebooks by default, so we will check if the module can be imported and, if not — install it.
# import yfinance or install it first
try:
    import yfinance as yf
except:
    !pip install yfinance
    import yfinance as yf
Clean up the data
Have we got unique tickers for all the instruments? I already know there are some duplicates in the sheet; we will drop these rows.
# drop the duplicates
tradeable.drop_duplicates(subset='Symbol', keep='first', inplace=True)
Time to collect the historical share price data
Now we can use yfinance to collect the daily price data for every ticker in our list for the last three months. Depending on the number of shares in the ticker list(currently ~3400) and the internet speed, this will take about ten minutes. It collects the open, high, low, close and volume data. We are only going to use the adjusted close, with the auto_adjust set to True. The data frame called share_data can be saved and used for other analyses. If you want to explore it further, remove the # from the line share_data.to_csv('share_data.csv').
%timeit
# use yfinance to collect the data
share_data = yf.download(tradeable.Symbol.to_list(),
                         period="3mo",
                         interval="1d",
                         auto_adjust=True,
                         back_adjust=True,
prepost=True)[*********************100%***********************] 3387 of 3387 completed
13 Failed downloads:
- BF.B: No data found for this date range, symbol may be delisted
- BRK.B: No data found, symbol may be delisted
- PBR.A: No data found, symbol may be delisted
- JW.A: No data found, symbol may be delisted
- FTIV: No data found, symbol may be delisted
- LGF.B: None
- BF.A: No data found, symbol may be delisted
- OIBR.C: No data found, symbol may be delisted
- HEI.A: No data found, symbol may be delisted
- IPOC: No data found, symbol may be delisted
- LGF.A: No data found, symbol may be delisted
- CWEN.A: No data found, symbol may be delisted
- LEN.B: None# select just Apple from the multiindex to eyeball data
share_data.xs('AAPL', axis=1, level=1).head()
# unquote line below to save all in GDrive/Colab Notebooks
# share_data.to_csv('share_data.csv')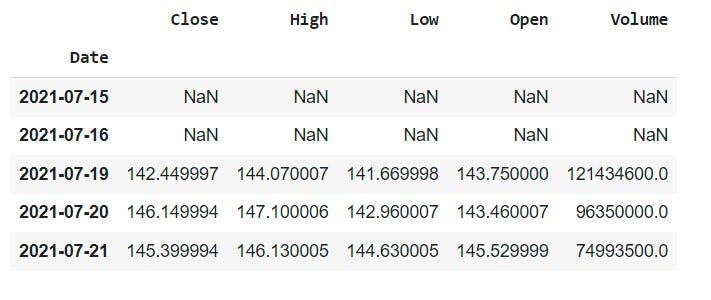
Data Wrangling (I)
For calculating the growth, we only need the daily close price. And then, to compare all of the stocks to each other, we calculate the percentage change from one daily close to the next.
# select the close column for each ticker
data_close = share_data['Close']
# calculate the daily percentage change
data_returns = data_close.pct_change(1)# eyeball the data
data_returns.head()
# there are normally NaN in the first couple of rows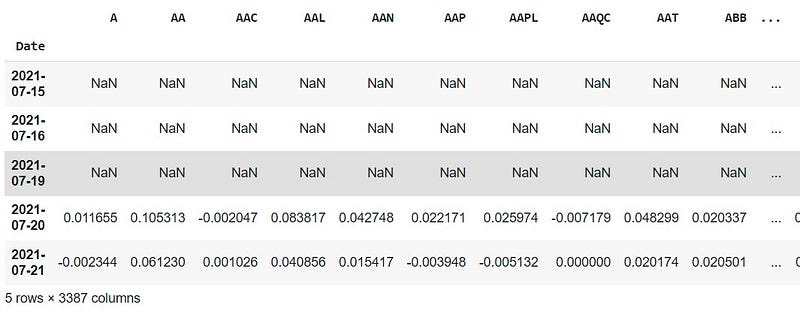
Data Wrangling (II)
Sometimes stock splits do not get calculated properly into the adjusted close price, and I like to get rid of any stocks that jumped too far in a single day. For example, when a biotech gets positive clinical trial results and I have missed the boat!. So, the next step is to drop any rows that grew by more than 90% in a day. You can adjust the threshold value.
# set the growth theshold
daily_growth_threshold = 0.9
# keep only the columns without a daily growth that big
data_returns = data_returns.loc[:, ~(data_returns >=daily_growth_threshold).any()]Data Calculations
Next, it's time to calculate the cumulative percentage growth of the share price. Unfortunately, you can't just add percentages up, but have to apply them to 1 first, calculate the product, and take the 1 away again. e.g. if the stock grew 5% one day and 3% the previous day:-
(1 + 0.05) * (1 + 0.03) = (1.0815–1)
So 8.15%, not 8%. Fortunately, this is easy to do on an extensive data set using Python!
# calculate the cumulative daily growth
data_cum_returns = (1 + data_returns).cumprod() -1
The Current Top Ten
Results time! Print out a table and charts for the current top ten shares with the highest stable growth rates in the last three months.
# take the last row
latest = data_cum_returns.tail(1).T.mul(100)
# label the column
latest.columns = ['% change']# show the top ten
topten = round(latest.sort_values(by='% change', ascending=False)[:10], 2)
topten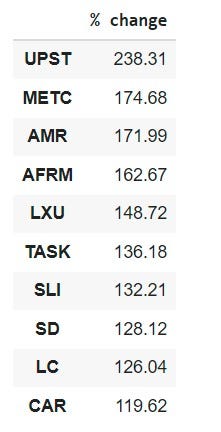
# plot the current top ten
data_cum_returns[list(topten.index)].mul(100).plot(subplots=True,
                                          layout=(5, 2),
                                          figsize=(12,12),
                                          sharex=True,
                                          ylabel='%',
                                          title='The Current Top Ten Momentum Stocks')
# tweek the layout
plt.tight_layout(rect=[0, 0.03, 1, 0.95])
plt.show()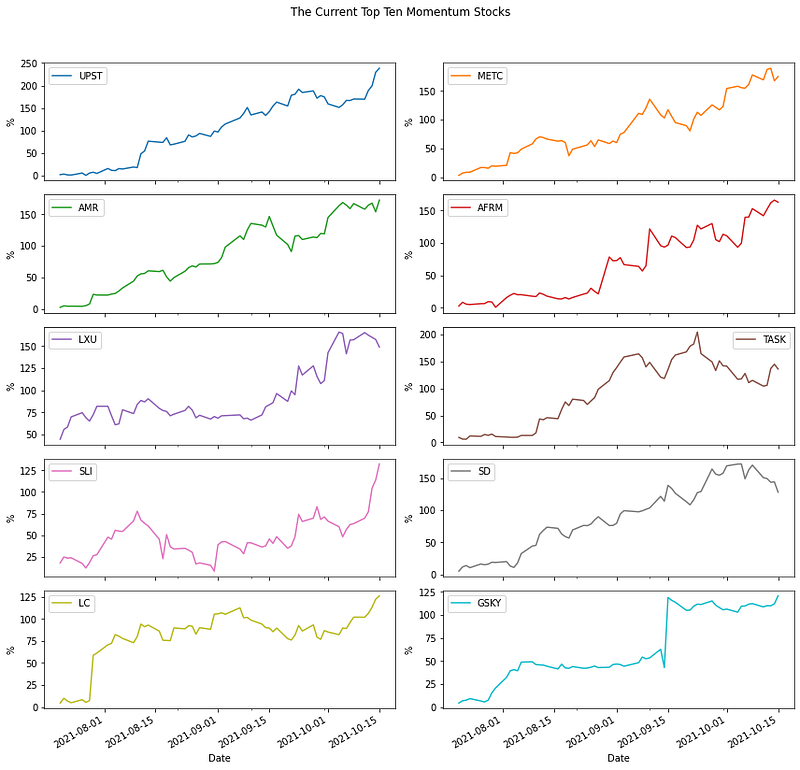
Getting Further Company Information
Looks promising! You probably don't want to choose stocks based on the price chart alone. Fortunately, it is quick and easy to scrape far more information than price alone using yfinance. For each ticker in the top ten, we can get lots of financial and company information (currently 157 fields of data) and drop it into a spreadsheet for further reading.
# get further information
topten_info = {}
for i in topten.index:
topten_info[i] = yf.Ticker(i).info# add the information to a data frame
info_df = pd.DataFrame.from_dict(topten_info,orient='index')# add the growth data
info_df['Growth'] = topten# rank the companies by growth rate
info_df.sort_values(by=['Growth'], ascending=False, inplace=True)
info_df.head()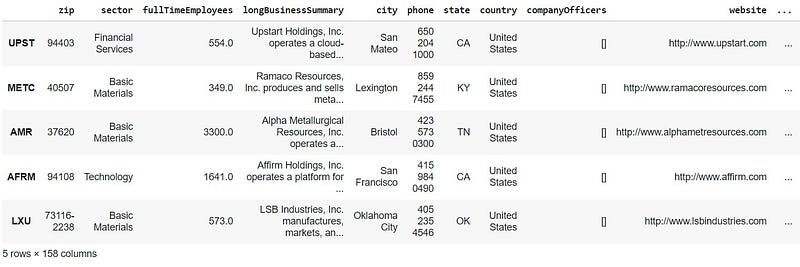
# which sectors are hot?
info_df['sector'].value_counts()
Basic Materials 4
Technology 3
Financial Services 2
Energy 1
Name: sector, dtype: int64Save the information
Okay, that's it — job done! It's possible to output the information table to Google Drive; it usually lands in the Colab Notebooks folder if you have run this online.
# save the spreadsheet for further reading
info_df.to_csv('growth_shares_info.csv')References
- Momentum Trading
- Google Colab
- Read data from Google Sheets
- Python Requests
- StringIO
- Read a CSV from an URL
- Using Yahoo Finance
- yfinance
- Download from my Github
- To run the code yourself: open in colab — select runtime — run all
Thanks for reading, and I hope you found my story and code useful! If you want to say hello and chat with me, try one of these LinkedIn, Twitter, and Medium.
I am a big fan of Medium, and I can highly recommend becoming a member today.


