
How to Visualize Your Project Structure With Python
Visualizing complex information is an easy way to quickly understand the overall context. In this manner, connections and structures can be quickly identified. In this article, we will learn how to visualize any folder structure using Python.

Why Should You Visualize Your Project Structure?
There are several reasons you should visualize your project’s folder structure. Introducing a new colleague to a project, understanding the organization of your files and code, finding inconsistencies, and much more. It is always better to have a proper visualization of your project instead of guiding someone through the file tree or even file explorer.
How Can I Visualize My Project Structure?
There are several libraries and tools to visualize any folder structure. In this tutorial, we will use the Directory-Grapher from GitHub. It uses Graphviz in the background to create diagrams like in the first screenshot. In the following sections, we will visualize the repository of the website by Brittany Chiang.
Requirements
You will need the dir.py from this GitHub repository by AlexEidt. You can clone the whole repository or just download the dir.py. Apart from that you will need to download and install Graphviz, you can get it from here. Finally, you have to install the requests library.
Visualize the folder structure
After setting everything up, you are good to go to visualize any folder structure. The Directory-Grapher offers the following options (click here for all options):
- Displaying all files in the directories.
- Displaying hidden files.
- Displaying memory usage of the given folders.
- Displaying in different orientations like left-to-right, bottom-to-top, etc.
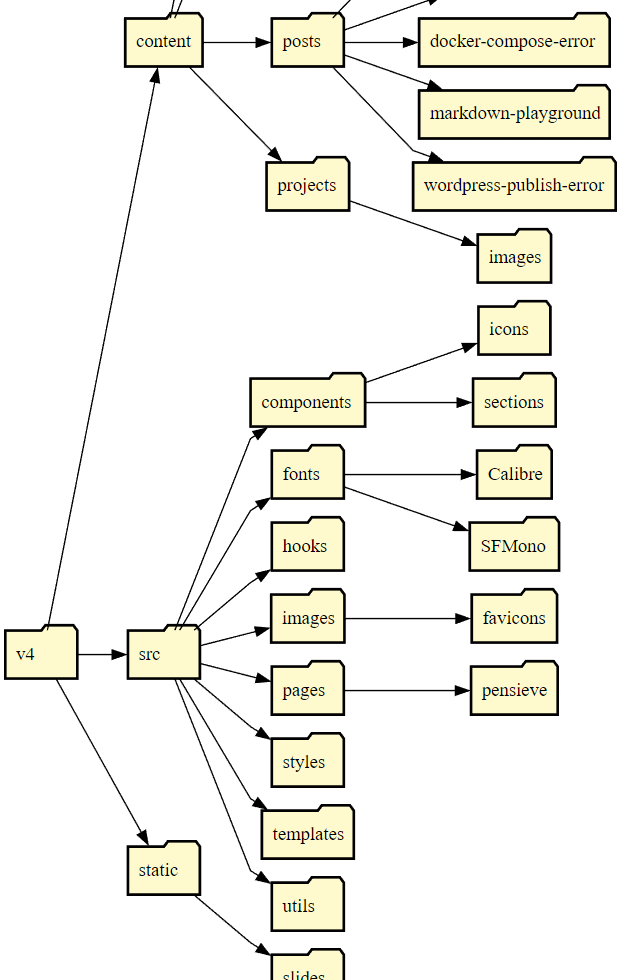
By running the following command you can create the visualization of your project.
python .\dir.py -dir v4 -ot LRIt will create the following svg of folder v4 with a left-to-right orientation.
Including all files and displaying the memory usage is possible with the following command:
python .\dir.py -dir v4 -ot LR -m -f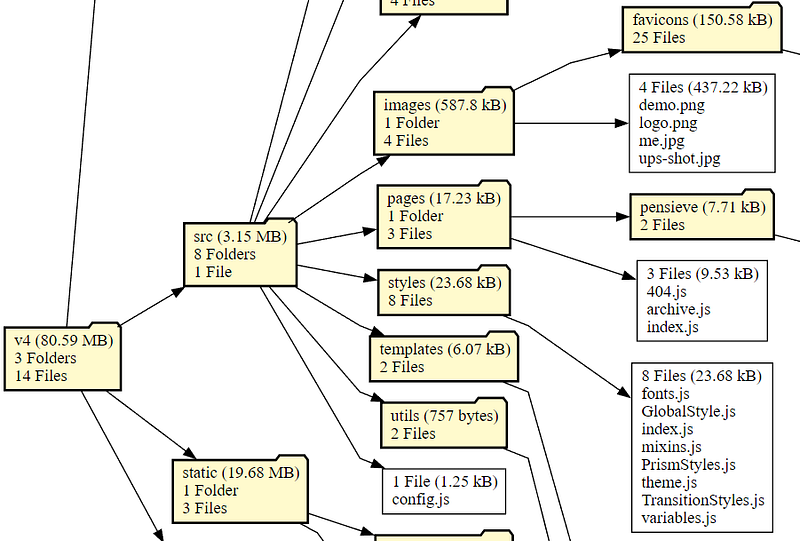
If you enjoy reading stories like these and want to support me as a writer, consider following me. If you have any questions, feel free to ask them in the comment section.
Thanks for reading! Before you go, consider subscribing to my content and get all my articles in your inbox. You can subscribe here! You can also sign up for my newsletter to get extra free content delivered right to your inbox.


