
How to Visualize Neural Network Architectures in Python
A quick guide to creating diagrammatic representation of your Neural Networks using Jupyter or Google Colab

1. Introduction
Often while working with Artificial Neural Networks or other variations like Convolution Neural Networks or Recurrent Neural Networks, we want to visualize and create a diagrammatic representation of our compiled model. This can solve two purposes:
- While defining and training multiple models allows us to visualize the depth of our model and compare different layers and how they are sequentially laid down.
- Allows better understanding of the model structure, activation functions used in each layer, shape of each layer (number of neurons), and parameters that need to be trained
There are a few packages readily available in python that can create a visual representation of our Neural Network Models. The first three packages can be used even before a model is trained (the model needs to be defined and compiled only); however, Tensor Boards requires the user to train the model on accurate data before the architecture can be visualized.
2. Quick Guide on Installation
pip install visualkeraspip install ann_visualizerpip install graphvizWe don’t need to install the “Tensor Board” and “Keras Model Plot” separately. This will come with the initial installation of Tensorflow & Keras.
3. Setting Up Tensorflow Packages
We may utilize only a few of the libraries listed below. Most libraries can convert a TensorFlow model to a diagram without explicitly training it on data. You can consider this as a single source of truth. Some libraries, like Pandas, Skimage, and OpenCV, will come in handy when reading structured data or images.
# Import necessary librariesimport pandas as pdimport numpy as np # Import numpyfrom skimage import data, io # Import skimage library (data - Test images and example data.# io - Reading, saving, and displaying images.)from skimage.color import rgb2grayimport matplotlib.pyplot as plt # Import matplotlib.pyplot (Plotting framework in Python.)%matplotlib inlineimport os # This module provides a portable way of using operating system dependent functionality.os.environ['TF_CPP_MIN_LOG_LEVEL'] = '3'import warnings# Suppress warningswarnings.filterwarnings('ignore')from IPython.display import displayimport cv2 as cv
from sklearn.metrics import confusion_matrixfrom sklearn.model_selection import train_test_splitfrom tensorflow.keras import utilsfrom tensorflow.keras.models import Sequential,load_modelfrom tensorflow.keras.layers import Dense, Dropout, Flatten, Conv2D, MaxPool2D, BatchNormalizationfrom tensorflow.keras.optimizers import Adamimport tensorflow as tfimport seaborn as snsSome helpful links for exploring more content around ANNs & CNNs from scratch.
4. Setting Up Convolution Neural Network Models
We will be defining three different CNN models with different hyperparameters. Ideally, in the real world, we aim at implementing different architectures to maximize accuracy or any relevant metrics, considering we are building the model for a multi-category classification task. Our choice of problem type won’t have any impact on how to put the visualization packages to use.
We created user-defined functions to build three different models separately with a different number of CNN layers, max-pooling, and dense layers.
4.1 - Architecture 1 — Shallow CNN layers + ANN layers
def construct_model():model = Sequential()model.add(Conv2D(filters=64, kernel_size=(3, 3), input_shape=(128, 128, 1), activation=’relu’))model.add(Conv2D(filters=64, kernel_size=(3, 3), activation=’relu’))model.add(MaxPool2D((2, 2)))model.add(Flatten())model.add(Dense(256, activation=’relu’))model.add(Dense(12, activation=’softmax’))model.compile(loss=’categorical_crossentropy’, optimizer=’adam’, metrics=[‘accuracy’])return model4.2 — Architecture 2 — Deep CNN + Shallow ANN Layers
def sconstruct_model():smodel = Sequential()smodel.add(Conv2D(filters=64, kernel_size=(3, 3), input_shape=(128, 128, 3), activation=’relu’))smodel.add(Conv2D(filters=64, kernel_size=(3, 3), activation=’relu’))smodel.add(MaxPool2D((2, 2)))smodel.add(Conv2D(filters=128, kernel_size=(3, 3), activation=’relu’))smodel.add(Conv2D(filters=128, kernel_size=(3, 3), activation=’relu’))smodel.add(MaxPool2D((2, 2)))smodel.add(Conv2D(filters=128, kernel_size=(3, 3), activation=’relu’))smodel.add(Conv2D(filters=128, kernel_size=(3, 3), activation=’relu’))smodel.add(MaxPool2D((2, 2)))smodel.add(Flatten())smodel.add(Dense(256, activation=’relu’))smodel.add(Dense(12, activation=’softmax’))#optimizer = Adam(lr=0.001)smodel.compile(loss=’categorical_crossentropy’, optimizer=’adam’, metrics=[‘accuracy’])#model.summary()return smodel4.3 — Architecture 3 — Deep CNN & ANN Layers
def cconstruct_model(learningRate):smodel = Sequential()smodel.add(Conv2D(filters=32, kernel_size=(3, 3), input_shape=(128, 128, 1), activation=’relu’))smodel.add(Conv2D(filters=32, kernel_size=(3, 3), activation=’relu’))smodel.add(MaxPool2D((2, 2)))smodel.add(Conv2D(filters=64, kernel_size=(3, 3), activation=’relu’))smodel.add(Conv2D(filters=64, kernel_size=(3, 3), activation=’relu’))smodel.add(MaxPool2D((2, 2)))smodel.add(Conv2D(filters=128, kernel_size=(3, 3), activation=’relu’))smodel.add(Conv2D(filters=128, kernel_size=(3, 3), activation=’relu’))smodel.add(MaxPool2D((2, 2)))smodel.add(Flatten())smodel.add(Dense(256, activation=’relu’))smodel.add(Dense(256, activation=’relu’))smodel.add(Dense(12, activation=’softmax’))optimizer = Adam(lr=learningRate)smodel.compile(loss=’categorical_crossentropy’, optimizer=optimizer, metrics=[‘accuracy’])smodel.summary()return smodelmodel=cconstruct_model(0.001)5. Visualization using ANN Visualizer
A Python module named ANN Visualizer makes it possible to visualize an artificial neural network with a few lines of code (Gheorghiu, 2022). It uses Keras and Python’s Graphviz module to produce a tidy and appealing neural network graph. You have the flexibility to visualize the entire Deep Learning Network or just the Convolutional Neural Network you have created driven by advances in deep learning (Shah, 2018).
Use the following structure below to generate a pdf representation of your neural network. However, before that, we need to compile the above models.
model=construct_model()ann_viz(model, view=True, filename=”network.gv”, title=”MyNeural Network”)
- model — Sequential Model from Keras
- view — Visualize the graph after the ann_viz() has been called
- filename — Name of the file
- title — Any specific title to denote the graph
from ann_visualizer.visualize import ann_vizann_viz(model, view=True, filename=”cconstruct_model”, title=”CNN — Model 1 — Simple Architecture”)
6. Visualization using Visual Keras
A Python tool called Visualkeras makes it easier to see Keras neural network designs (either separately or as part of TensorFlow). The majority of styling needs can be met with ease. Convolutional neural networks (CNNs) benefit significantly from developing layered-style architectures. Most models, including simple feed-forward networks, benefit greatly from the generation of graph-style architecture, which this module supports (Gavrikov, 2022).
model1=construct_model()model2=sconstruct_model()model3=cconstruct_model(0.009)import visualkerasfrom PIL import ImageFontvisualkeras.layered_view(model1, legend=True)visualkeras.layered_view(model2, legend=True)visualkeras.layered_view(model3, legend=True)

7. Keras Model Plot
The keras.utils.plot_model provides inbuilt functions to plot a model defined and compiled through Keras using Graphviz and pydot packages. Graphically it is less intuitive than the packages used above, but it outlines the basic architecture of a sequential model (Team, n.d.).
tf.keras.utils.plot_model(model1,to_file="model.png",show_shapes=True,show_dtype=False,show_layer_names=True,rankdir="TB",expand_nested=True,dpi=96,layer_range=None,show_layer_activations=True,)
Few hyperparameters to consider:
- model: An instance of Keras compiled model or model object
- to_file: File Name of the image
- show_shapes: display dimension and shape of each layer in the neural network
- show_layer_activation: display activation functions used within the Neurons

8. Tensor Board
TensorBoard is a dashboard interface that allows users to visualize logs across different model runs. Logs can range from tracking any model validation measure like accuracy, recall, RMSE, MAPE, and MSE across different epochs to creating a conceptual graph of the model’s architecture. It’s a powerful tool to visualize if the intended model matches the expected design while driving insights on how a model can be changed using an op-level graph.
To utilize this functionality we need to load TensorBoard first and then create a log directory.
%load_ext tensorboardfrom datetime import datetimefrom tensorflow import keras# Define the Keras TensorBoard callback.logdir="logs/fit/" + datetime.now().strftime("%Y%m%d-%H%M%S")tensorboard_callback = keras.callbacks.TensorBoard(log_dir=logdir)Create the Keras TensorBoard callback and specify the log directory before training. You may ensure that graph data is logged for TensorBoard visualization by supplying this callback to model.fit(). Once you invoke the TensorBoard, it might take a few minutes to load.
model.fit(X2_train, Y2_train,batch_size=64,epochs=5,callbacks=[tensorboard_callback])Note: X2_train and Y2_train are training datasets not reflected in the codes above. You can replace this with any training data of your own.
TensorBoard always shows the op-level graph by default. (The “Default” tag is highlighted on the left.) The graph is upside down in comparison to the code because data flows from bottom to top. But as you can see, the graph roughly resembles the description of the Keras model, with additional edges leading to other computation nodes (Tensorflow, 2022).
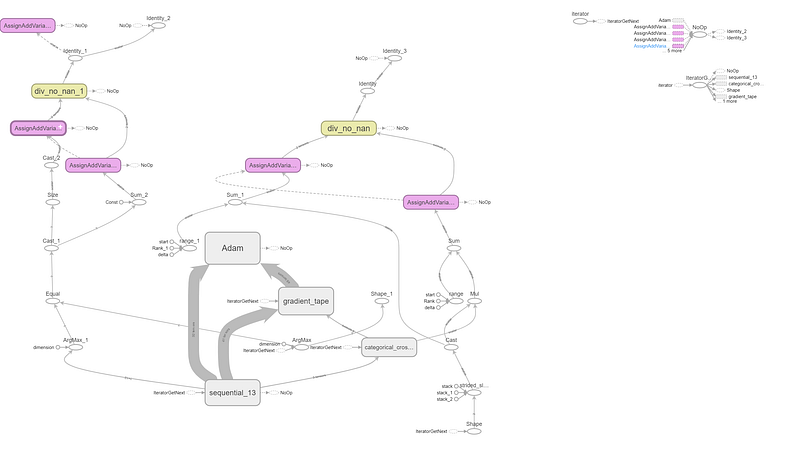
More context on how to use TensorBoard can be found under Reference.
9. Conclusion
From a commercial standpoint, where a user has to present their analysis to a group of stakeholders, these diagrams add more complexity to the discussion. They may not be an extreme value add. However, from an academic and learning perspective, there is merit in utilizing these packages to display these deep learning architectures. ANN visualizer, to me, stands out over the rest since it’s easy to digest the diagram, whereas TensorBoard’s graph output requires more technicalities before the results can be consumed.
10. Reference
Gavrikov, P. (2022, April 13). visualkeras for Keras / TensorFlow. GitHub. https://github.com/paulgavrikov/visualkeras
Gheorghiu, T. (2022, October 21). ANN Visualizer. GitHub. https://github.com/RedaOps/ann-visualizer
Shah, A. (2018, April 28). Visualizing Artificial Neural Networks (ANNs) with just One Line of Code. Medium. https://towardsdatascience.com/visualizing-artificial-neural-networks-anns-with-just-one-line-of-code-b4233607209e
Stack Overflow. (n.d.). machine learning — How do you visualize neural network architectures? Data Science Stack Exchange. Retrieved October 29, 2022, from https://datascience.stackexchange.com/questions/12851/how-do-you-visualize-neural-network-architectures
Team, K. (n.d.). Keras documentation: Model plotting utilities. Keras.io. Retrieved October 29, 2022, from https://keras.io/api/utils/model_plotting_utils/#modeltodot-function
Tensorflow. (2022, January 6). Examining the TensorFlow Graph | TensorBoard. TensorFlow. https://www.tensorflow.org/tensorboard/graphs
About the Author: Advanced analytics professional and management consultant helping companies find solutions for diverse problems through a mix of business, technology, and math on organizational data. A Data Science enthusiast, here to share, learn and contribute; You can connect with me on Linked and Twitter;


