
How to Visualize Football Passing Networks Using Python
Generate insights from the playing pattern of a team

In this article, I will show you how to visualize passing networks using Python. In case you are still new to the visualization, the result will look like this:
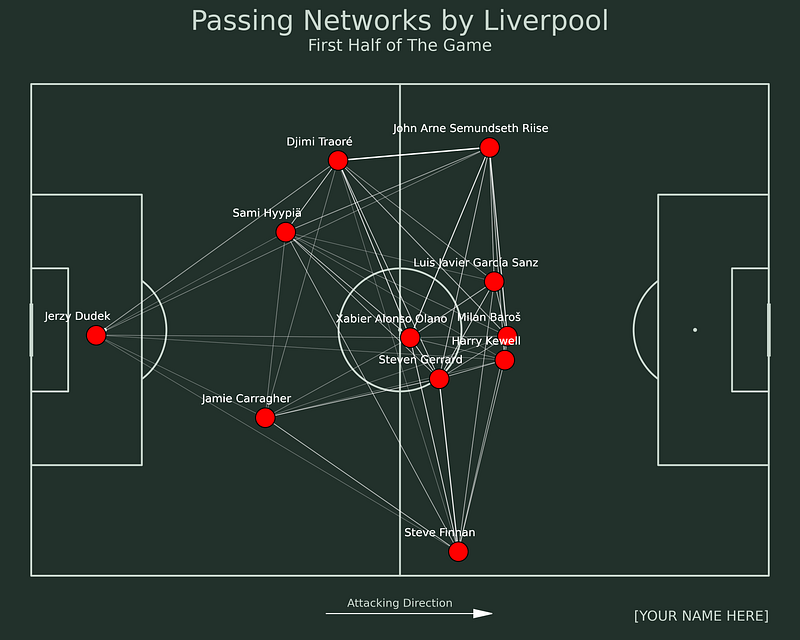
So what are passing networks? Passing networks is a visualization that represents the playing patterns of a team in terms of their passes.
From there, we can see how each player interacts between them by the number of passes and whose the receivers. Also, we can see how the players’ average position is in that game.
Without further ado, let’s get started!
Implementation
Data Source
We will use a data source from the StatsBomb open data. The data contains football event data from competitions like UEFA Champions League Final, 2018 FIFA World Cup, Euro 2020, La Liga, etc.
To access the data, you can access it through the GitHub repository here. Now let’s access the data.
In this article, we will create passing networks from Liverpool in the first half. We will use the ‘miracle of Istanbul’ match as the source data.
Because the data is divided into folders, we have to find the corresponding id that marks the match.
There are several steps to retrieve the data. First, we need to look at the competitions.json file and filter the data that contains the UEFA Champions League matches. Here is the code for doing that:
The match is held in the 2004/2005 season. As you can see from above, The corresponding competition and season ids are 16 and 37, respectively. Let’s use those ids to retrieve all matches from that season. Here is the code for doing that:
As you can see from above, the corresponding id for the match is 2302764. That id is also used as the filename that contains the match’s event data.
Although the data is in a JSON format, we can open the data using pandas with the json_normalize function. Let’s open the data by using these lines of code:
Because we want to divide the data based on halves, we will filter the data first. Here is the code for doing that:
Plan of Attack
Now we have the data. To generate the passing networks, we need to do several steps. Here are those steps:
- Filter the data that contain information about passes,
- Get the data on the number of passes between two different players,
- Get the data of player’s average positions,
- Combine those data,
- Retrieve the top 11 players based on their playing minutes,
- And lastly, Generate the passing networks.
Filter the data
The first step that we need to do is to filter the data. We filter the data that contains information about Passes. We can use Pandas to filter the data. Here is the code for doing that:
Retrieve the number of passes between players
After we get the data, we need to calculate the number of passes between players. For doing that, we need to retrieve columns like the passer’s name, the receiver’s name, and the timestamp as a decoy. Here is the code for doing that:
To count the number of passes between specific pairs, we need to create an identifier first. Here is the code for doing that:
After that, we can calculate the number of passes by aggregating them based on the identifier using the count. Let’s use these lines of code:
Calculate the players’ average position
The next step that we need to do is to calculate the players’ average position. To do that, we need to retrieve columns like the player’s name and location. Here is the code for doing that:
After we retrieve the columns, we calculate the player’s average position by aggregating the data based on the player’s names.
Because the location column is in a list format, we need to create two columns that represent the x and y coordinates, respectively. Here is the code for doing that:
Merge both data
After we get the data that we need, the next step is to merge the data. We will merge the data that contains the number of passes between different pairs and also the players’ average position.
Because we’ve created the identifier, we can join the data easier. Here is the code to merge data that contains the number of passes:
To merge the players’ average position data, we can use the merge function and use the player’s name as the identifier. Here is the code for doing that:
Retrieve 11 players with the most playing minutes
Because we want to create the passing networks, there is a possibility that a team has more than 11 players playing in a single game.
Therefore, we need to filter the data and retrieve the top 11 players from Liverpool. Here is the code for doing that:
After we get the top 11 players, we can filter the data by using these lines of code:
Build the passing networks
But wait, before we do that, we need to create one more column to represent the width of our passing networks, where the width will be used as the marker that determines the frequencies of passes. Here is the code for doing that:
Now we are reaching the final step, which is to build the passing networks. To generate the visualization, here is the code for doing that:
I know that is a long line of code. In case you want to know more details about that code, you can read documentation from the mplsoccer library through the link here. Also, you can read my article about the mplsoccer library through the link below:
Final Remarks
Well done! Now you have learned on how to generate passing networks using Python. I hope you can learn lots of things like aggregating data, filtering the data, creating the visualization, and many more.


