
How to Visualize Expression Trees as Graphs in SymPy
Your Daily Dose of Computer Algebra

About this series: Learning to use computer algebra systems with ease requires a lot of practice. To help you on your journey to mastery, follow me in this series and solve common and not-so-common problems using systems like SymPy, Sage, or Mathematica.
Today’s Problem
Advanced expression manipulation in SymPy requires knowledge about the internal representation of expressions in terms of an expression tree. It is very helpful to visualize such a representation. This is what today’s problem is about.
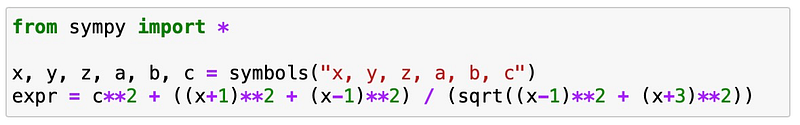
Create the following SymPy expression

and visualize its internal representation as a graph like in the header of this article.
Solution
The easy part is to create the expression itself. Just define the symbols and build the expression:

The internal representation as a string can easily be obtained from SymPy’s sreprfunction:
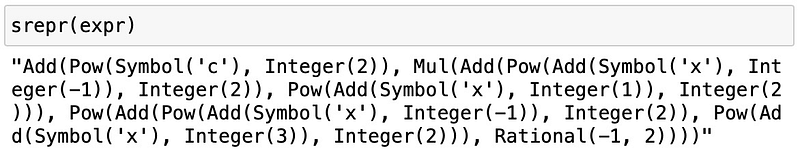
Looks pretty complicated, right? That’s why a visualization is quite handy. We have to turn that into a graph. To do that, write a little function to scrape the nodes and then we will convert that into a graph using the networkx package. If you don't have that installed, do it with
pip install networkxOnce you have copied and pasted the code for our little function at the end of this article, you can use it like that:

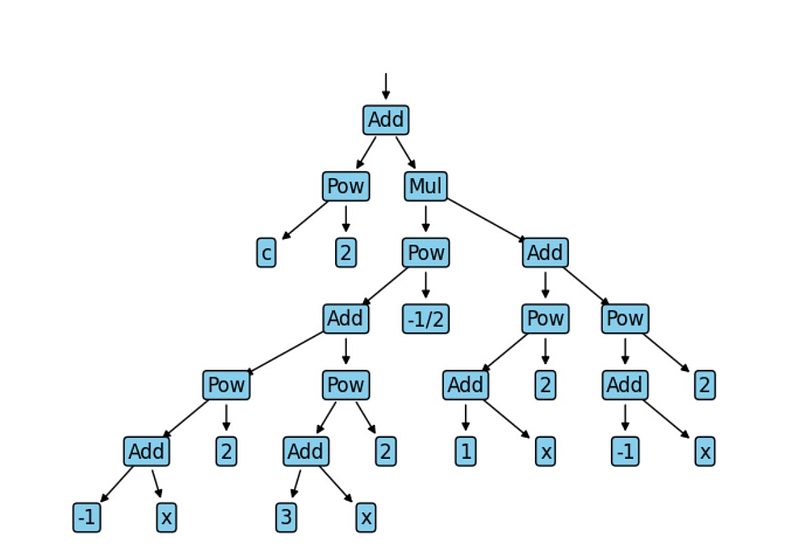
Most of the content of the plot_graph function is just bookkeeping. We defined some helper classes for representing nodes and node-IDs, but the essential part is the internal _walk function, which recursively goes over the expression and creates nodes and links between the nodes. We store all that in a JSON format, which can be read by networkxand use its graphviz layout function to draw the graph as a tree structure. If you are not interested in the details of the code, that's fine, but I highly recommend having such a visualization function in your toolbox, so you may want to grab the code and simply use it for yourself.
And finally, here is the code:
If you found this article useful, you may want to consider becoming a Medium member to get unlimited access to all Medium articles. By registering using this link you can even support me as a writer.


