
How to visualize Decision Trees and Random Forest Trees?
Sklearn provides built-in functions to display the decision path of a tree’s model (https://scikit-learn.org/stable/auto_examples/tree/plot_unveil_tree_structure.html).
If we can visualize this path, it would be more intuitive and helpful for you to create a fancy report.
In this article, I am going to introduce 2 packages that help you to make this happen.
Installation:
pip install pybaobabdt
pip install pygraphviz
(1) Decision Tree Visualization
Dataset: https://github.com/lpfgarcia/ucipp/blob/master/uci/wine-quality-red.arff
import pybaobabdt
import pandas as pd
from scipy.io import arff
from sklearn.tree import DecisionTreeClassifier

data = arff.loadarff('wine-quality-red.arff') # Import dataset
df = pd.DataFrame(data[0])

y = list(df['Class'])
features = list(df.columns)
features.remove('Class')
X = df.loc[:, features]

clf = DecisionTreeClassifier().fit(X, y)
ax = pybaobabdt.drawTree(clf, size=10, dpi=300, features=features)  #Visualize the tree
It’s too large right? We can set the depth of it to make it more visible:
ax = pybaobabdt.drawTree(
    clf,
    size=10,
    dpi=100,
    maxdepth=6,  # The depth of the tree
    features=features)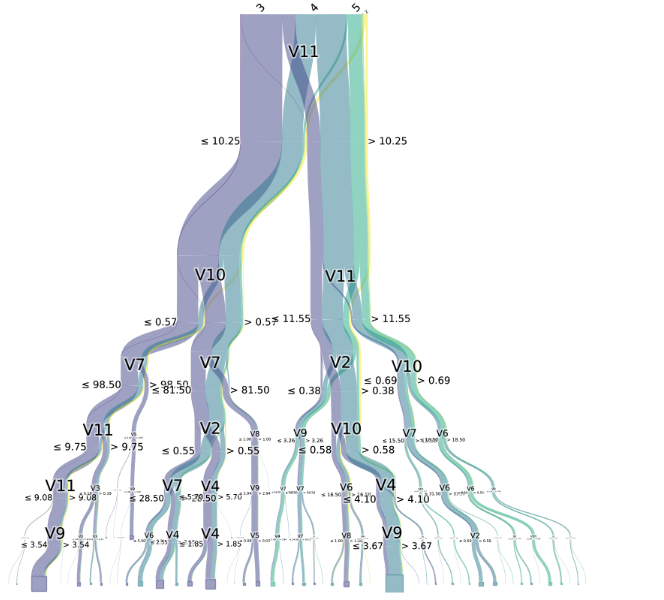
By using colormap, we can also highlight specific class:
from matplotlib.colors import ListedColormap

ax = pybaobabdt.drawTree(
    clf,
    size=10,
    dpi=600,
    maxdepth=6,
    colormap=ListedColormap(["#01a2d9", "gray", "#d5695d",
                             "gray"]),  # Highlight Class 3 and 5
    features=features)
(2) Random Forest Visualization
Actually it is similar to visualize a decision tree. We can just use a loop to draw every single tree.
Dataset: https://github.com/renatopp/arff-datasets/blob/master/classification/vehicle.arff
import pybaobabdt
import pandas as pd
from scipy.io import arff
import matplotlib.pyplot as plt
from sklearn.ensemble import RandomForestClassifier

data = arff.loadarff('vehicle.arff')  # Import dataset

df = pd.DataFrame(data[0])
y = list(df['Class'])
features = list(df.columns)
features.remove('Class')
X = df.loc[:, features]

clf = RandomForestClassifier(n_estimators=20, n_jobs=-1, random_state=0)
clf.fit(X, y)

size = (15, 15)
plt.rcParams['figure.figsize'] = size
fig = plt.figure(figsize=size, dpi=300)

for idx, tree in enumerate(clf.estimators_):
    ax1 = fig.add_subplot(5, 4, idx + 1)
    pybaobabdt.drawTree(tree,
                        model=clf,
                        size=15,
                        dpi=300,
                        maxdepth=8,  # Set the depth for each tree
                        features=features,
                        ax=ax1)
Thank you for reading.


