
How to Value a Company

Introduction
This article will give an overview of how to determine the intrinsic value of a business using Discounted Cash Flow (DCF). It will also provide an overview of Streamlit app that can aide in doing this type of analysis.
Discounted Cash Flow Analysis Overview
The premise of discounted cash flows is that a dollar today is worth more than that same dollar a year from now. How much? It depends on the rate of return that you could get on the dollar today. For instance, if you had a bond that would return 5% each year, your dollar today will be worth $1.05 a year from now. Stated in reverse, the dollar a year from now, is only worth $0.95 today. One dollar two years from now would get discounted twice and consequently only be worth $0.91. This rate of return is often referred to as the discount rate.
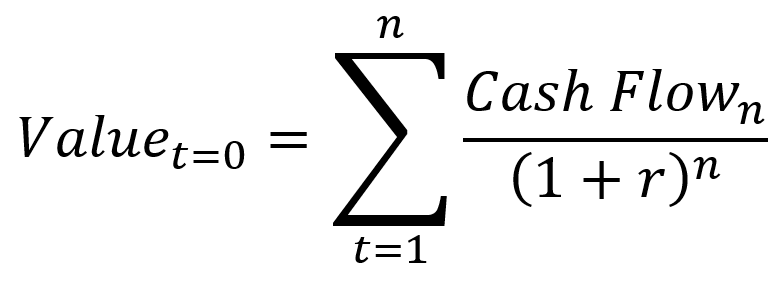
Applying this approach to a company’s earnings can approximate the value of the company. You can discount all future earnings to the present by dividing the discount rate raised to the power of years in the future. By summing together all the discount cash flows produced by a company we can generate an approximate value for the company.
What’s the Catch?
There are a couple challenges with this approach. The first is, what discount rate should be used? Warren Buffet has historically used the risk free rate approximated by treasury bills. The current treasury bill rate is so low that this doesn’t really make sense (present rate is 1.35% compared to 8% from 20-30 years ago). The second problem is that we don’t know with certainty how much money a company will generate next year, let alone 10 years from now. These two factors typically make the intrinsic value calculation some what fuzzy, since both the numerator and denominator are based on estimates.
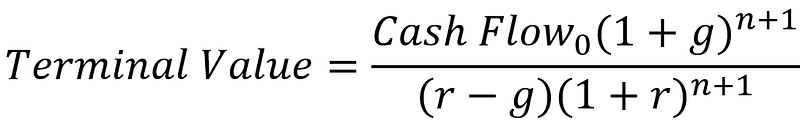
In addition to the challenges with estimating the discount rate and future challenges, how long should we add in the cash flow for? If the earnings increase at a rate that is faster than the discount rate and run forever, the value of the company will be infinite. To deal with the uncertainty in how long the company will generate profits and what those will look like, a terminal value is added in. It is based on the difference between the growth rate of the cashflows against the discount rate r and is then discounted to the present.
Dashboard to Simplify the Process
Because there is a lot of math going and estimation on here, I created a simplified dash board using Streamlit to assist. It should let you play with different discount rates and earning growth rates to come up with a potential ranges of valuation.
The function below will take in input from the user for discount rate, various growth rates and duration to determine the value.
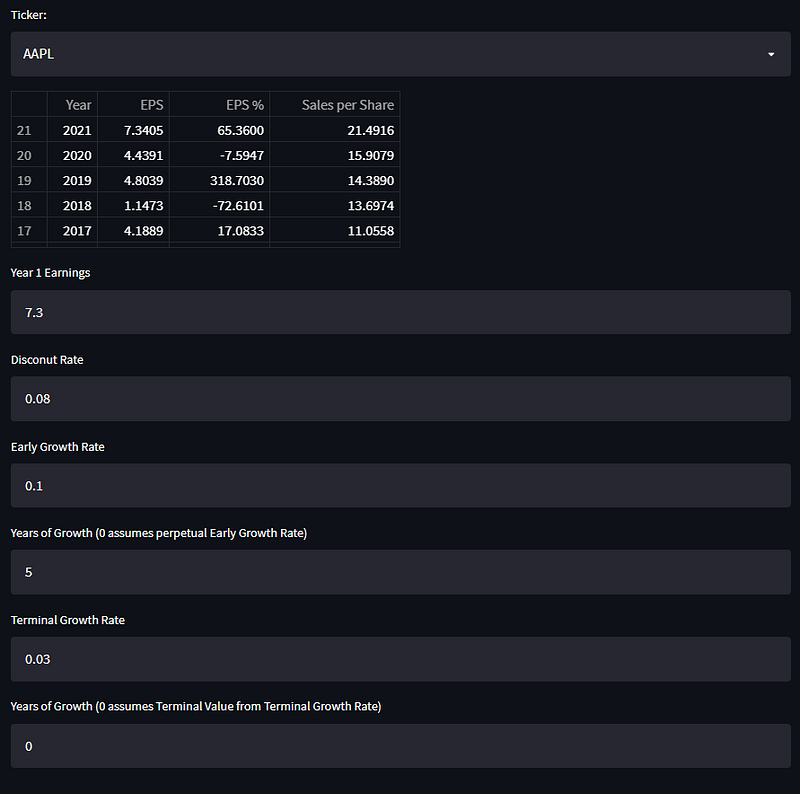
The dashboard also includes some company fundamental information to help with the forecast of future earnings. Below is an example for AAPL. The table shows the earnings information and allows the user to adjust the discount rate and 2 separate growth rates.
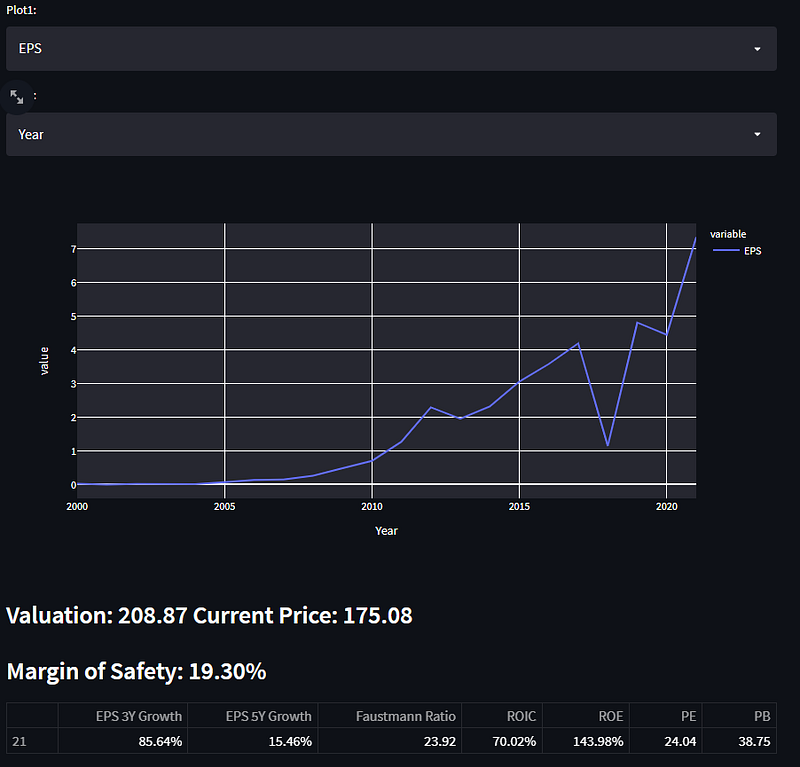
The second half of the dash board will plot relevant fundamental stock data and compare the valuation of the company against the current market price. Based on the settings I chose above, it looks like AAPL is currently undervalued ($208.87 compared to the market value of $175.08).
The complete file for the dashboard and some sample data can be found out on Github.
Conclusion
Hopefully at the end of this article you came away with a better understanding of how to approximate the intrinsic value of a company using DCF and get a chance to check out the dashboard that I created.
Note that this article does not provide personal investment advice and I am not a qualified licensed investment advisor. All information found here is for entertainment or educational purposes only and should not be construed as personal investment advice.