
How to use the Support Vector Machine (SVM) as a classifier
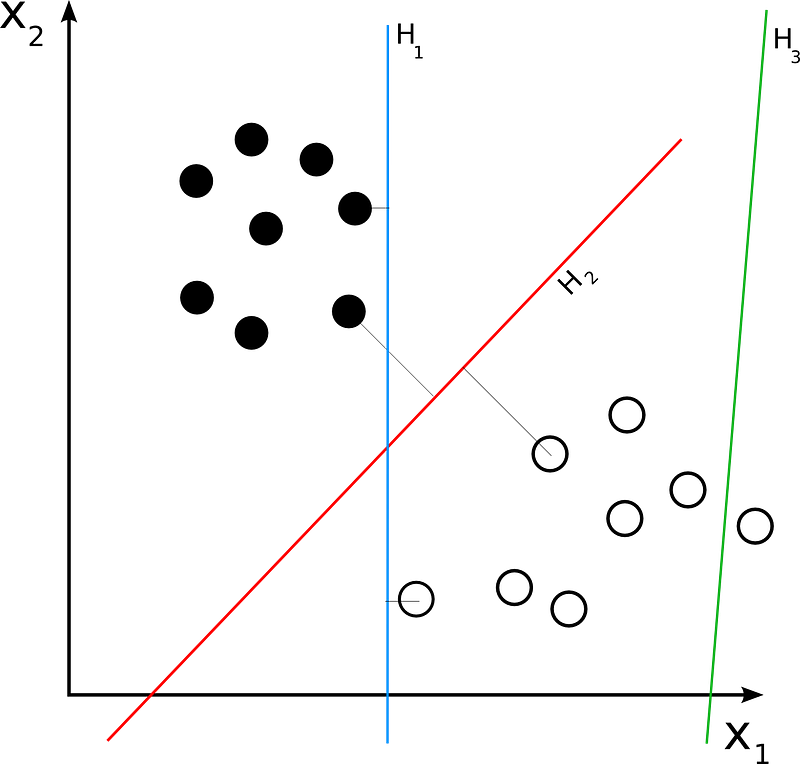
As I have progressed in the machine learning course that I am taking, I have progressed to Support Vector Machines, or SVMs. A SVM is a type of supervised learning classification algorithm. SVMs differ from other classification algorithms in the way they choose the decision boundary that maximises the distance from the nearest data points of all the classes.
In order to illustrate how the SVM works to classify data, I found a dataset that the SVM will make accurate predictions on. I chose a bill authentication dataset that I found on the premier data science website, Kaggle. One good thing about using datasets that are stored in Kaggle’s computer system is the fact that the notebooks the programs are written on are easily retrievable from the system.
I had the choice of downloading the dataset onto my laptop or using the dataset on Kaggle, and I decided to stay on Kaggle so I could keep my work all in one place. I therefore created a Jupyter Notebook in Kaggle that would support this dataset.
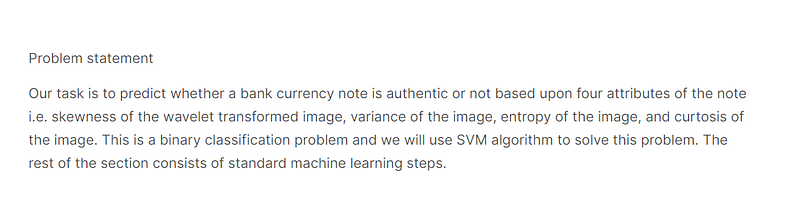
The problem statement for this project can be found in the screenshot below:-
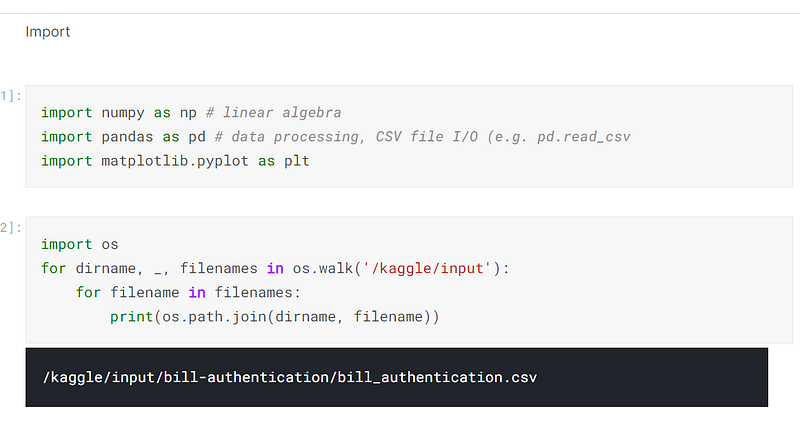
After I created the dataset, I imported the libraries that I would need. I normally import libraries as I need them, but there are a few libraries that I customarily import at the beginning of the program, such as numpy, pandas, matplotlib and os. Numpy is a library that provides high speed algebraic calculations, Pandas creates and manipulates dataframes, matplotlib provides graphical support, and os goes into the operating system and retrieves the csv files in that directory:-
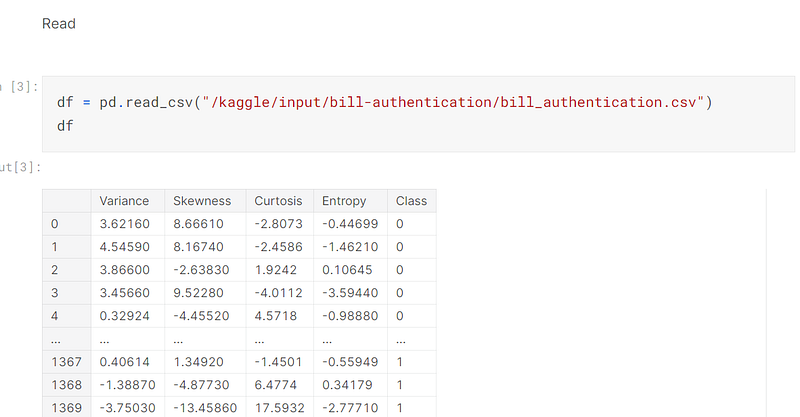
Once the libraries had been installed and the csv file had been located in the system, I read it into the program and created a dataframe from it:-
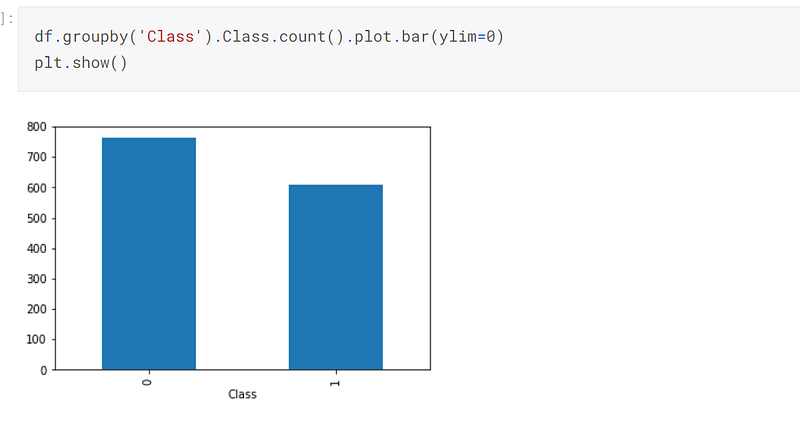
I analysed the target, which is seen in the screenshot below. There are slightly more 0’s than 1’s:-
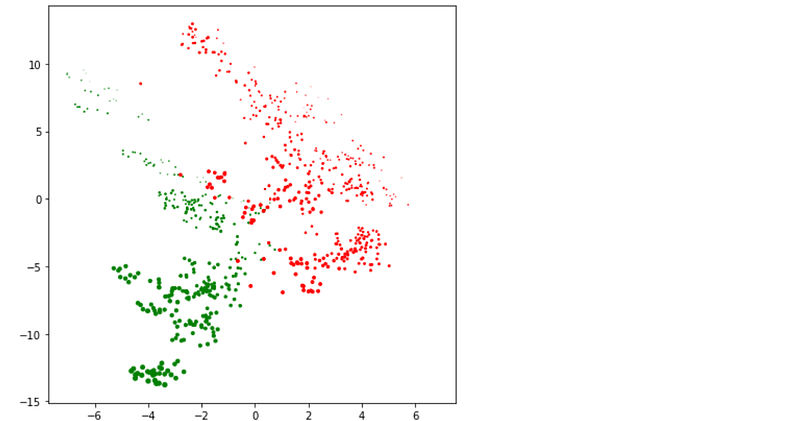
I created a graph of the 0’s and 1’s, which is seen below. As can be seen, there appears to be a linear line that demarks the two classes of the target:-
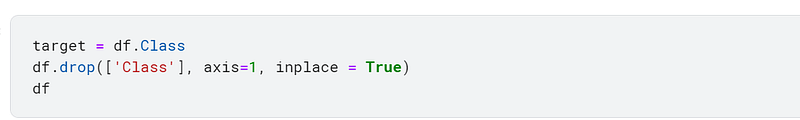
Once the target had been analysed, I dropped the column, Class, from the dataset and posited this information in the variable, target. The target will be used later on in the program:-
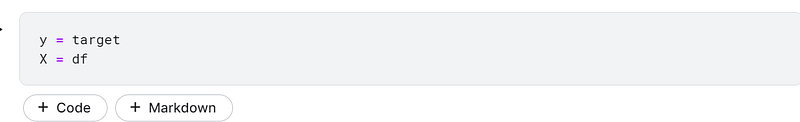
I then defined the X and y variables. The y variable is the dependent variable, with the target being posited in it. The X variable is independent, and has the contents of the dataframe posited in it (less the column, Class):-
It is at this point that I would have normalised the X variable. When I was writing the program, I did normalise it, but I found that the accuracy was greater without normalisation, so that step of the process is not included in this post.
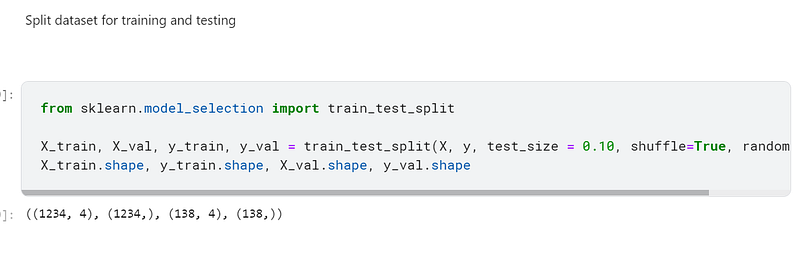
I then split the X and y variables up for training and validation, using sklearn’s train_test_split to accomplish this:-
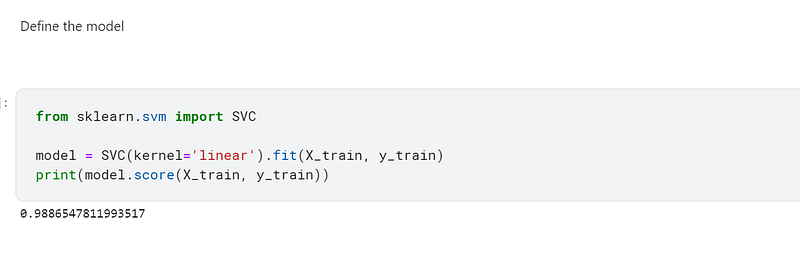
Once the data had been preprocessed and split, I defined the model, using sklearn’s SVC. I achieved a 98.87% accuracy using this model:-
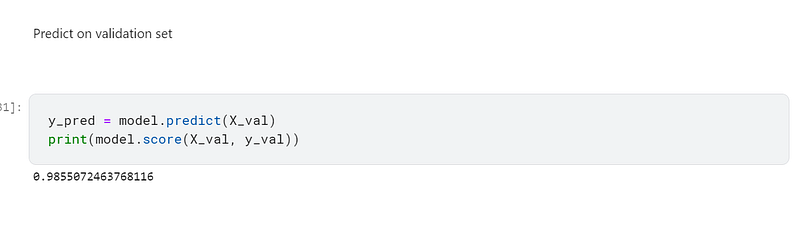
I then predicted on the validation set and achieved a 98.56% accuracy:-
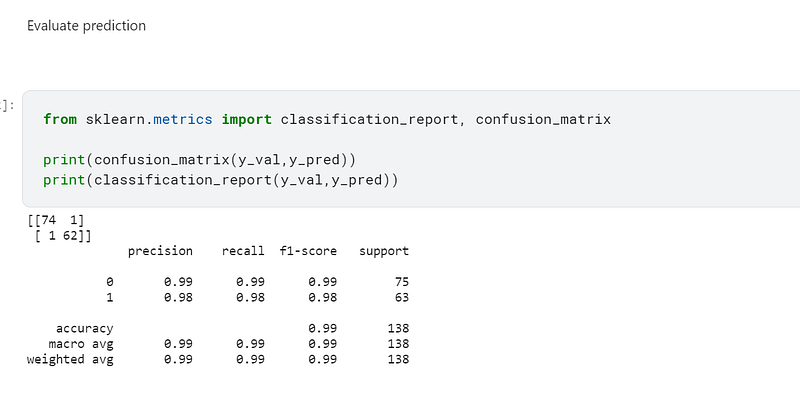
I then used sklearn’s classification_report and confusion_matrix to evaluate the predictions.
According to the confusion matrix, only one example in the 0 and 1 classification were incorrect.
In the classification report, the F1-score is a weighted harmonic mean of the precision and recall scores, such as the best score is 1 and the worst score is 0. F1 scores are generally lower than accuracy measures because they embed precision and recall into their computations. The F1-score is a parametric that should be used to measure classifier models, and not accuracy:-
The code for this program can be found in my personal Kaggle account, the link being here:- https://www.kaggle.com/tracyporter/bill-authentification-svm