
How to use Python to convert numerical grades to alphabetical ones

I have been taking a free Introduction to Data Analysis course with Udacity and have come across an exercise where numeric grades are supposed to be converted to alphabetic grades. This task is supposed to be completed in Python. I came up with a solution of my own, but have included the instructor’s solution as well to give the reader several options as to how to go about solving this particular problem.
I have written this program in Coogle Colab, which is a free online Jupyter Notebook that I have written the solution to the problems of the entire lesson in. The great thing about Google Colab is the fact that it is portable and can be accessed on any computer that has an internet connection and a search engine. The downside of Google Colab is the fact that it does not have an adequate undo function, so care needs to be taken not to overwrite or delete valuable code, otherwise it will be lost forever.
Although it is not explicitly written in the code, the libraries pandas, numpy and math need to be imported into the program.
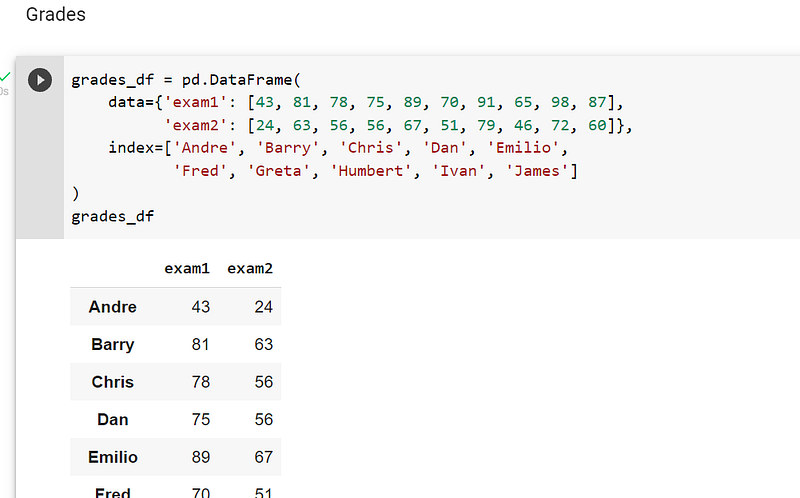
The dataframe is coded directly into the program, so a csv file does not need to be imported:-
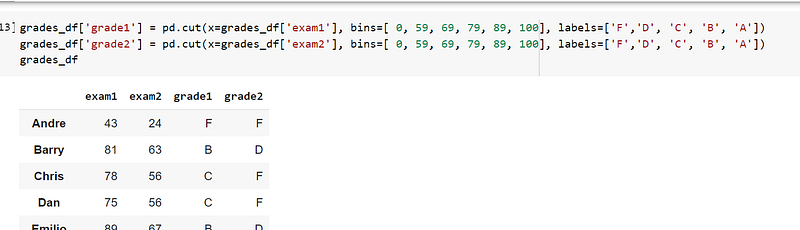
One way to convert numeric grades to alphabetic grades is to create separate columns of bins where each alphabetic grade is placed. The code to create bins can be seen in the screenshot below:-
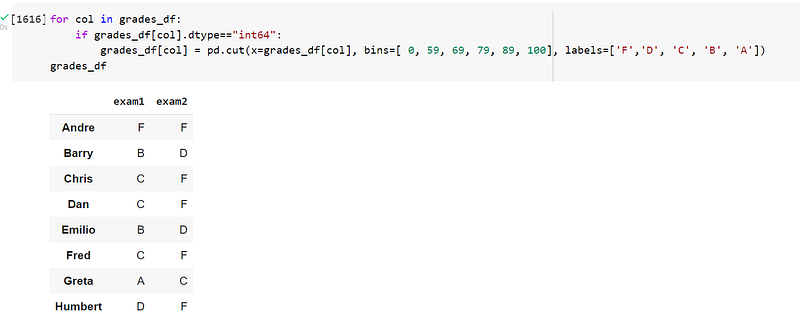
Another way to create bins is to use a for loop, where the program iterates through each column in the dataframe. The example code can be found in the screenshot below:-
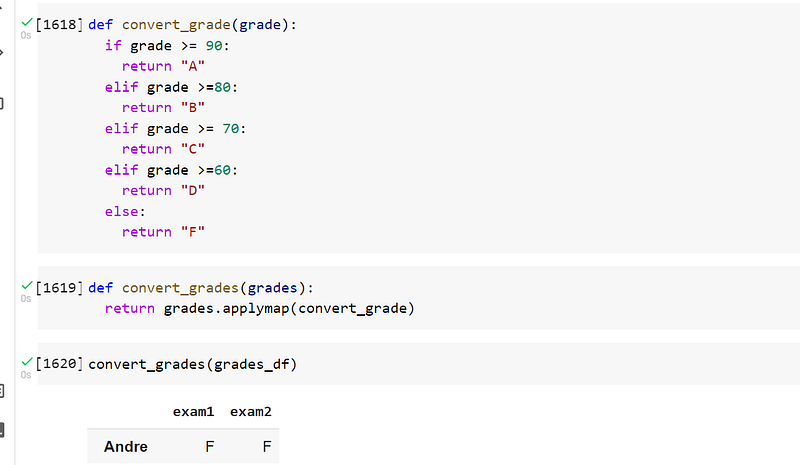
The way the Udacity instructor solved the problem was to create a function that is a series of if-elif-else statements to assign each number to a letter in the alphabet.
Another function, convert_grades, was created to use the function applymap to map the function, convert_grade, to the dataframe.
Lastly, the the function, convert_grades, was called to manipulate the dataframe, so the numeric grades were replaced with alphabetic grades:-
After the task of converting the numeric grades to alphabetic grades was completed, I was then given the problem where the numeric grades were supposed to be scored on a curve. I was not happy with the instructor’s solution because the only thing she did was to standardise the data, which is not grading on the curve in my opinion.
I therefore conducted a bit of research and found that an easy was to grade on the curve is to subtract the highest score from 100 and add this value to each score. For example, the highest score in exam1 was 98:-
100–98 = 2.
The value of 2 therefore should be added to each numeric grade in exam1.
In exam1, the highest score was 88:-
100–79 = 21.
The value of 21 should therefore be added to each numeric grade in exam2.
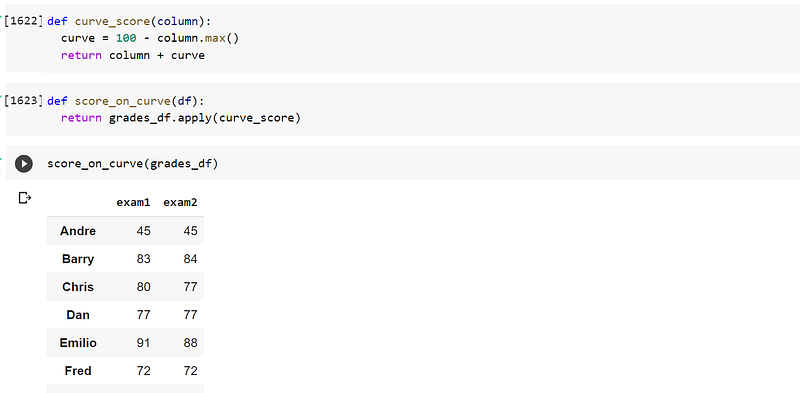
A function, curve_score, is created with the algorithm stated above.
A second function, score_on_curve, is created where the function, apply, is used to apply the function against all of the columns on the dataframe.
The function, score_on_curve, is created to apply the function, curve_score, across the entire dataframe:-
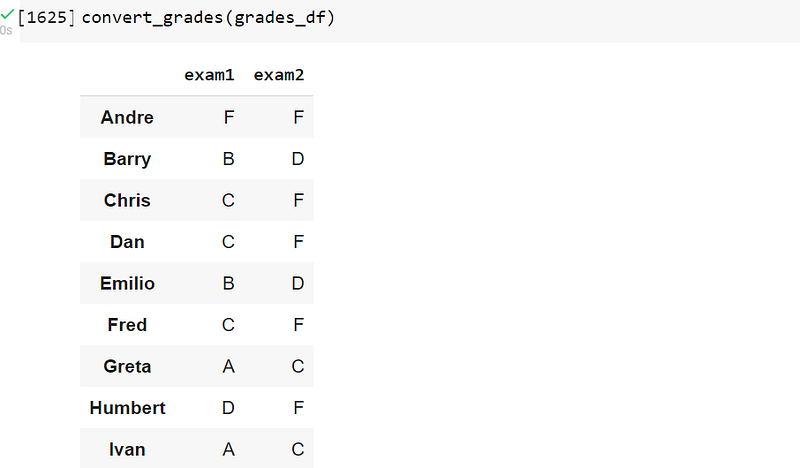
I then called the function, convert_grades, to convert the numeric grades to letters of the alphabet, being A to F:-
I have researched other more complex ways to grade on the curve, but that would require me to write a complete program to accomplish the task. I personally feel the method of grading the curve described above is suitable for this post. Time permitting, I may go to the trouble to create a more sophisticated program covering this topic.