
How to Use Python Pandas for Data Structures and Data Analysis.
It’s very easy to do, even a child can do it.

There are many different libraries that can be used to easily analyse any dataset. However, some libraries are more popular than others.
In this tutorial, we will take a look at the three most popular libraries for data analysis: Pandas, NumPy and Matplotlib.
Pandas is a library that provides easy-to-use data structures and data analysis tools. NumPy is a library that provides efficient numerical computing tools. Matplotlib is a library that provides plotting tools.
We will start by looking at how to use Pandas to load and examine data. We will then take a look at how to use NumPy to perform numerical operations on data. Finally, we will use Matplotlib to create visualisations of data.
Loading Data
The first step in any data analysis is to load the data. Pandas makes it easy to load data from a variety of sources, including CSV files, Excel files, JSON files and SQL databases.
In this example, we will load a CSV file containing data about countries. The file can be downloaded from here:
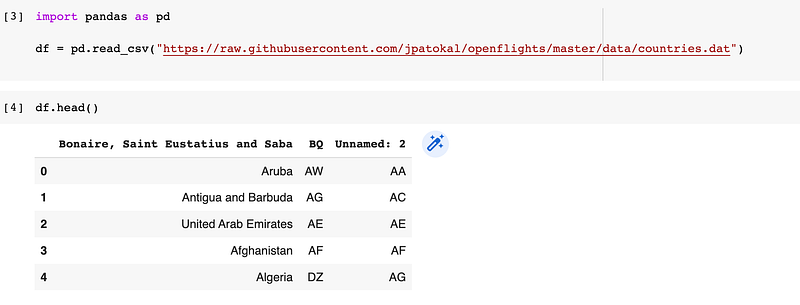
https://raw.githubusercontent.com/jpatokal/openflights/master/data/countries.datWe will use the read_csv() function to load the data:
import pandas as pddf = pd.read_csv(“https://raw.githubusercontent.com/jpatokal/openflights/master/data/countries.dat")The read_csv() function returns a DataFrame object. A DataFrame is a two-dimensional data structure that contains columns and rows.
Viewing Data
Once the data has been loaded, we can start to examine it. The first thing we might want to do is to view the first few rows of data:
df.head()which would return the following output:
We can also view the last few rows of data:
df.tail()which would return the following output:
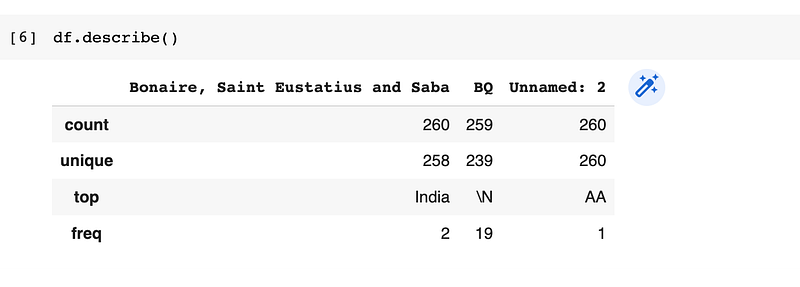
We can also view a summary of the data:
df.describe()
which would return the following output:
We can also view the data types of each column:
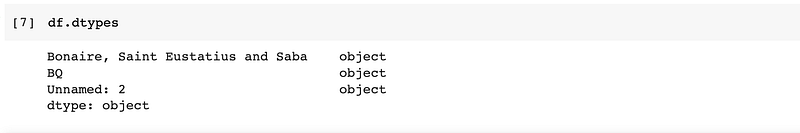
As we can see, the id column is of type int64, which means it contains integers. The name column is of type object, which means it contains strings.
Selecting Data
We can select data from a DataFrame using the following methods:
df[column_name]
df.loc[row_index]
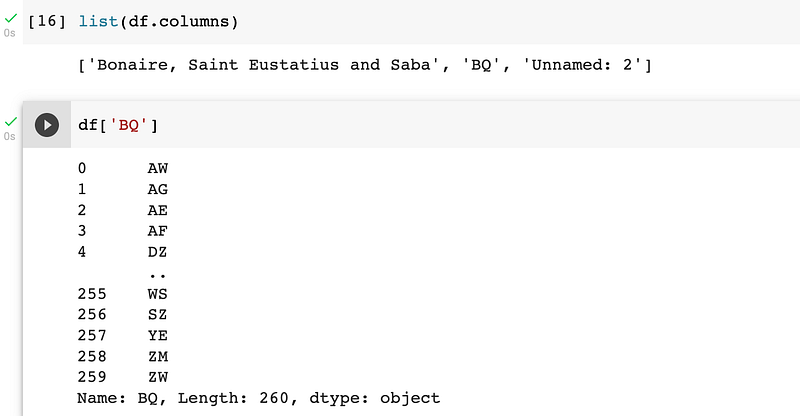
df.iloc[row_index]For example, if we wanted to select the id and name columns, we would use the following code:
df["BQ]which would return the following output:
Filtering Data
We can filter data using the following methods:
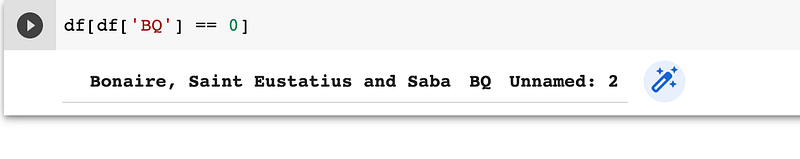
df[df[column_name] == value]
df.loc[df[column_name] == value]
df.iloc[df[column_name] == value]
For example
We can also use the loc and iloc methods to filter data. For example, if we wanted to filter the data to only include countries with an id less than 10, we would use the following code:
df.loc[df[“id”] < 10]Sorting Data
We can sort data using the following methods:
df.sort_values(by=column_name)
 df.sort_values(by=column_name, ascending=False)
For example, if we wanted to sort the data by id in ascending order, we would use the following code:
df.sort_values(by=”id”)Aggregation
We can aggregate data using the following methods:
df.mean()
df.median()
df.min()
df.max()
df.std()
df.sum()
In this tutorial, we have looked at one of the most popular library for data analysis: Pandas. We have seen how to use the library to load, examine and filter data.
Before you leave:
If you liked this article, don’t forget to give me a few claps, follow me and thus receive all updates about new publications.
If you enjoy reading stories like these, consider signing up to become a Medium member. It’s $5 a month, and you’ll receive unlimited access to stories on Medium.
So don’t wait — sign up now and start enjoying all that Medium has to offer.
About the author: Alain Saamego: Software engineer, writer and content strategist at SelfGrow.co.uk
Email:[email protected]
Follow me on Twitter if you want even more content.