
How to Trade with Harmonic Patterns — AB = CD and Gartley

There are a lot of ways to trade price action. I’ve already talked about Elliott Waves or other things such as support and resistance, and today I’ll talk about harmonic patterns.
What are the Harmonic Patterns?
Harmonic patterns are patterns used to identify price reversals using Fibonacci ratios.
They’re a bit similar to Elliott Waves, as they assume that the price moves in waves and cycles that repeat themselves. With the knowledge of these cycles, it is possible to try to predict where the price may get to before reversing.
Do Harmonic Patterns Work?
In trading, there is nothing that works 100%. So this is also the case for harmonic patterns. On the other hand, they can at least give a considerable advantage and help greatly in decision-making, as well as acting as confirmation signals.
Moreover, as is often the case with Fibonacci ratios, many people use them, which makes them self-fulfilling
We can therefore assume that harmonic patterns work with a certain reliability, but it is still better not to rely on them alone.
Types of Harmonic Patterns
There are many types of harmonic patterns. Here is the list:
- AB = CD pattern
- Gartley pattern
- Bat pattern
- Crab pattern
- Butterfly pattern
- Shark pattern
- Cypher pattern
These patterns follow basically the same principles, once you understand one you can understand all of them.
I’ll cover the AB = CD pattern and the Gartley pattern in this story.
How to Measure Retracements and Extensions?
To detect these patterns, we’ll need to measure retracements and extensions.
The easiest way to do it is to use something like Trading View as it includes a tool called “Fibonacci Retracements”.
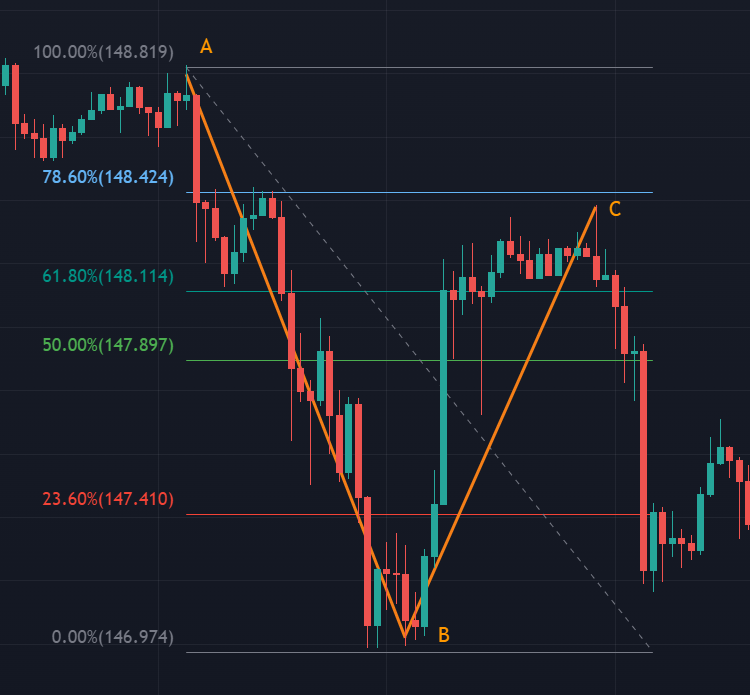
In the picture above, we can say that the retracement of the BC wave is something like 78% of the wave AB.
If we want to do it with maths, we have to measure the length of wave BC and divide it by the length of wave AB. For example here:
(148.424 - 146.974) / (148.819 - 146.974) = 0.785 = 78.5%It’s nearly the same thing for extensions.
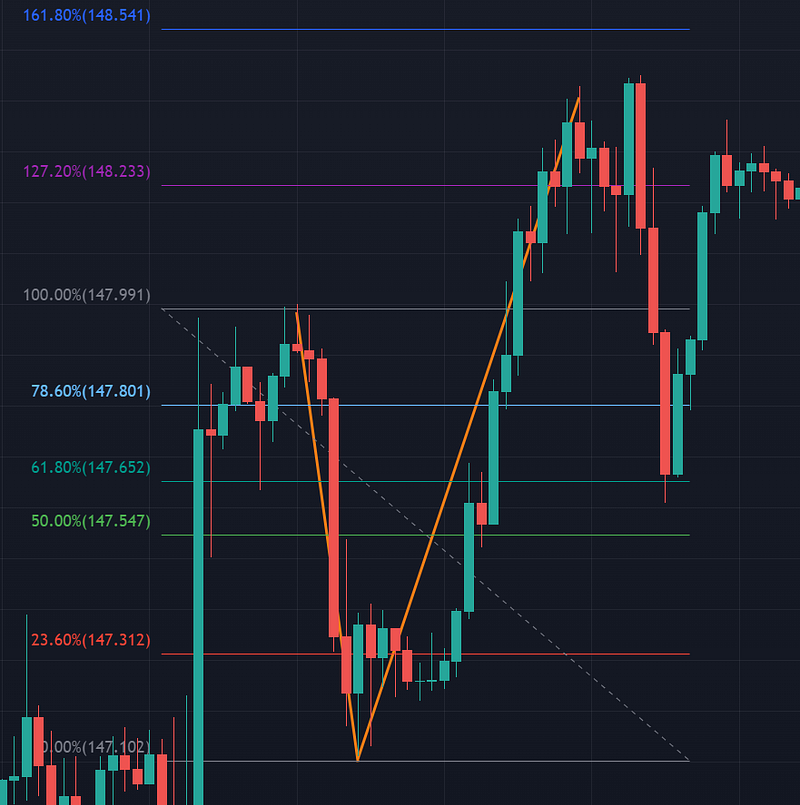
Here, the extension of wave BC is something like 150% of the length of wave AB.
We can confirm it with maths by dividing the length of wave BC by the one of wave AB:
(148.399 - 147.102) / (147.991 - 147.102) = 1.458 = 146%It’s important to understand how to do these calculations because harmonic patterns rely almost entirely on this.
AB = CD Pattern
Let’s start with the most basic pattern: AB = CD. It consists of 3 swings: AB, BC, and CD.
Then, after the CD swing, a reversal may occur.
Here are the rules to identify this pattern:
- Wave BC should retrace 61.8% of wave AB.
- Wave CD should extend at least 127.2% of wave BC.
- Wave CD should be approximately equal to wave AB, both in length and time.
Let’s take our Fibonacci tool to identify this pattern!
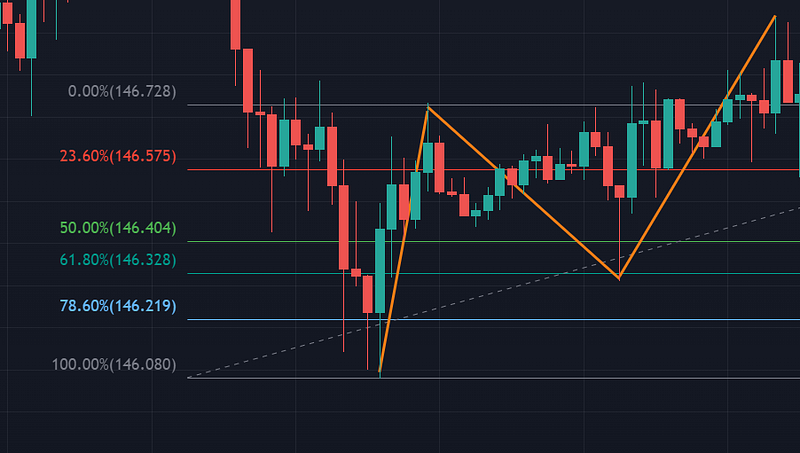
As you can see, I found a potential AB = CD pattern. The second wave retraced 61.80% of the first wave. Let’s check the extension now.
I’m sorry, we can’t see well in the picture, but the extension is at least 127.20%. In addition, we can see that waves AB and CD are almost equal, so it’s an AB = CD pattern.
It means a reversal may occur soon, so we can open a trade after a confirmation.
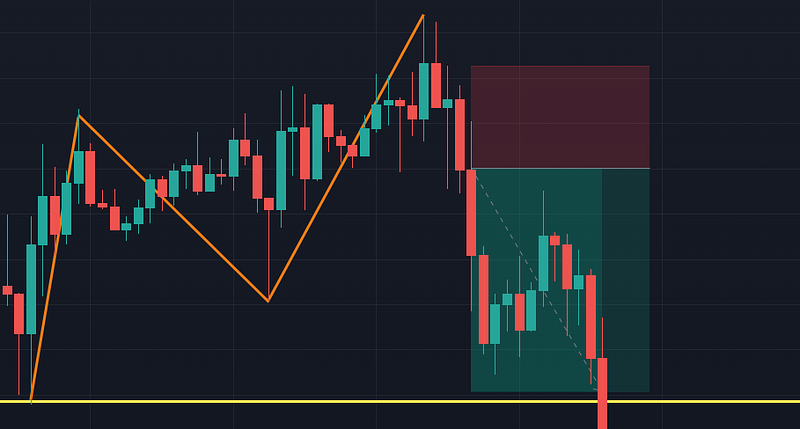
We enter after the big red candle. The stop loss is placed above the previous green candle, and the take profit is placed near the start of wave AB.
Gartley Pattern
This pattern is a bit harder to identify. It consists of 4 swings, XA, AB, BC, and CD.
Wave XA is an impulse wave, AB is a retracement of XA, BC is a retracement of AB, and CD is an impulse wave.
Here are the rules:
- AB should be at least 61.8% of wave XA.
- BC should be either 38.2% or 88.6% of wave AB.
- If the retracement of the swing BC is 38.2% of wave AB, then, the CD move should be 127.2% of wave BC.
- If wave BC is 88.6% of wave AB, the CD move should up to 161.8% of wave BC.
- Wave CD should be a 78.6% retracement of wave XA.
Well, that’s a lot of rules. To be honest, I've never found a perfect Gartley pattern. It’s impossible. So these rules are just here to have an idea about how the pattern should look.
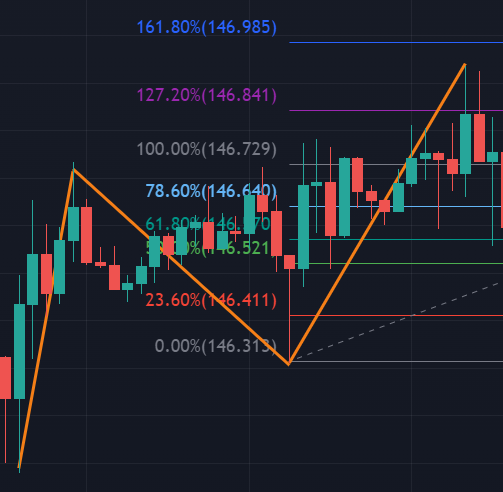
I’ve tried to find one, and here it is:
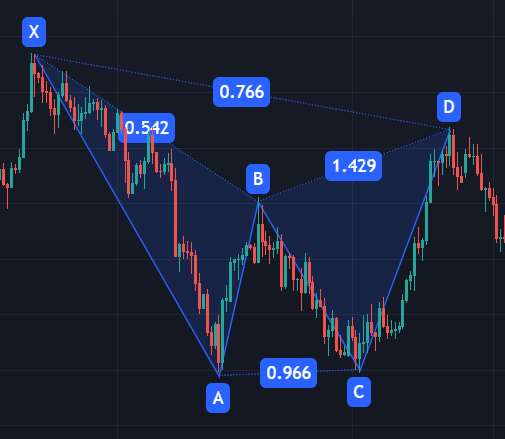
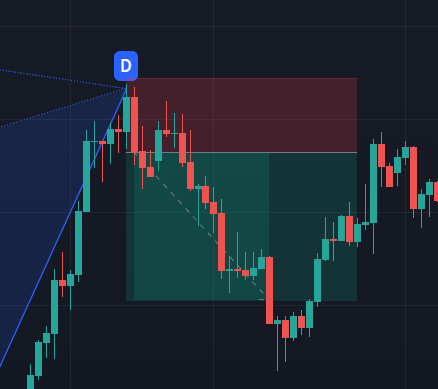
It looks like a cute butterfly! As you can see, the ratios are not perfect. And they will never be. But that doesn’t mean it’s not a Gartley pattern.
We enter after a confirmation, place a stop loss near the end of wave CD, and the target can be adjusted to have a good risk-reward ratio. In this example, the risk-reward ratio of the trade would be something like 2.
Final Note
As I said earlier, I’ll talk about the other patterns in another story. In the meantime, you can try to find these patterns in charts to train!
But one thing to know: these patterns are easy to find once the move has ended. When trading live, it’s sooo difficult to find them. That’s why it’s important to trade, and even backtest to check whether they really work or not.
Be sure to follow me if you don’t want to miss out the next story about harmonic patterns!
To explore more of my trading stories, click here! You can also access all my content by checking this page.
If you liked the story, don’t forget to clap, comment, and maybe follow me if you want to explore more of my content :)
You can also subscribe to me via email to be notified every time I publish a new story, just click here!
If you’re not subscribed to medium yet and wish to support me or get access to all my stories, you can use my link:
A Message from InsiderFinance

Thanks for being a part of our community! Before you go:
- 👏 Clap for the story and follow the author 👉
- 📰 View more content in the InsiderFinance Wire
- 📚 Take our FREE Masterclass
- 📈 Discover Powerful Trading Tools