
How to track statistics on all queries in your Postgres database to prevent slow queries or bottlenecks
Tweak your database performance to perfection with the crucial statistics that this extensions offers you

Have you ever wondered why some parts of your application are suddenly very slow? Can it be your database? How would you find out? Wouldn’t it be nice to have an extensions that tracks statistics over all queries that it executes so that you can analyze your database performance and clear up bottlenecks?
In this article we’ll look at a Postgres extension called pg_stat_statements. It keeps statistics on all queries that your database executes and thusly offers crucial information on the performance of your database. With it, you can easily track the performance of your database, detect slow queries, eliminate bottlenecks and prevent problems from happening.
We’ll first go through the very simple installation. Then we demo how to use it. Let’s code!
What does this extension do?
Pg_stat_statements is an extension of Postgres that tracks execution statistics of all queries executed by a server. This extensions keeps track of statics like
- number of times the statement was called
- fastest and slowest execution of the statement
- mean and standard deviation of the execution time of the statement
- total number of rows retrieved or affected
- information about blocks (hit, read, written, dirtied etc.)
This is very useful for analyzing the quality of your queries. Using the statistics it’s pretty easy to debug problems in the database, track slow queries and tables and prevent database-related problems.

Installation
Installing pg_stat_statements is pretty easy and just requires three steps. In this part we’ll go through each of the steps and then show you how to perform them on your locally installed Postgres instance and in a Dockerized version of Postgres. If you are unfamiliar with Docker check out this article that’ll go into the basics of Docker and this article on Docker Compose.
The steps are as follows:
- add a few lines to
postgresql.conf - create the extension in the database
- restart Postgres
1. Modifying postgresql.conf
This file stores some configurations for Postgres. We need to modify it in order to tell Postgres that it’s okay to store a few statistics on our statements.
Locally installed
First we’ll tackle the postgresql.conf file. Find the file (usually located in the data folder of the location where you’ve installed Postgres (windows example: C:\Program Files\PostgreSQL\14\data) and open it. Find the line that says # — Shared Library Preloading and add the following three lines:
shared_preload_libraries = 'pg_stat_statements'
pg_stat_statements.max = 10000
pg_stat_statements.track = all
Dockerized
We’ll define some extra commands in the docker-compose.yml file in order to add the extra lines to postgres.conf:
In line 13 we include pg_stat_statements to the shared_preload_libraries. Done!
Step 2: create the extension
This is a really simple step. We’ll just execute the statement below in PgAdmin (or another database GUI tool)
CREATE EXTENSION pg_stat_statements;Step 3: restart Postgres
Not that hard as well; in windows press control-r and run services.msc. Find Postgres, right click and restart. When using Docker just restart the container.

Demo
Now that all of the boring stuff is out of the way let’s check out the great advantages this extension can bring us! We’ll pretend to be a library, creating a database for renting out books.
Setup — creating the tables
We’ll create three tables:
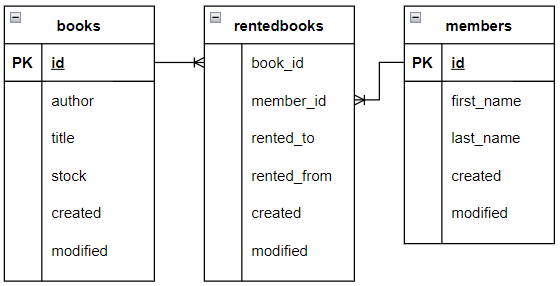
After executing the statements for creating these table we already see some stats when we call SELECT [some columns] FROM pg_stat_statements:
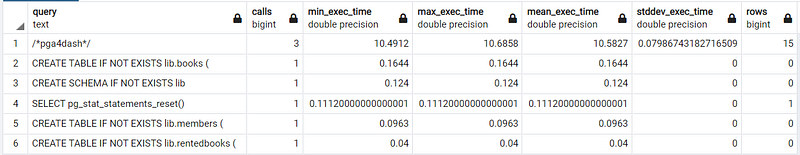
As you can see these statistics mainly concern the statements that created our tables.
Resetting our statistics
The next step is to insert some data so that we can run a few queries and check out the results. Since we’re not interesting in statistics on previous operations, we call SELECT pg_stat_statements_reset(); in order to clear all current statistics.
Insert some data and run some queries
Next step; insert some data!
And run some queries:
As you see we executed a few different queries.
Analyzing our queries
Now we can call SELECT * FROM pg_stat_statements and analyze execution statistics. I’ve made a selection of columns and ordered the rows by the mean execution time. This is what is returned:
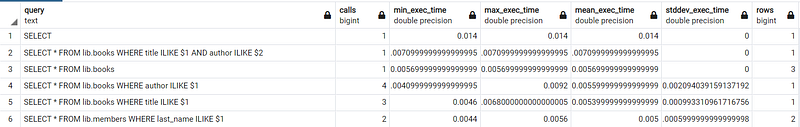
These results speak for themselves but let’s go through them very quickly. The first record contains the last, biggest query where we perform two joins, no wonder it’s the slowest!
Also notice that we made selections in lib.books, filtering on three different titles. This is represented by record 5; showing that we made three calls to the books table where we filter on title.

Conclusion
With this short article we’ve went through a very useful extension. I hope to have demonstrated the simple installation and value it can offer you to monitor and improve your database. If you have suggestions/clarifications please comment so I can improve this article. In the meantime, check out my other articles on all kinds of programming-related topics like these:
- DELETE INTO another table
- UPDATE INTO another table
- Insert, delete and update in ONE statement
- UPDATE SELECT a batch of records
- Inserting into a UNIQUE table
- Understand how indices work to speed up your queries
Happy coding!
— Mike
P.S: like what I’m doing? Follow me!


