
Data Visualization
How to Share your Jupyter Notebook with Mercury or Voilà
Putting your Jupyter notebook on the web is reasonably easy with either Mercury or Voilà but which is easier — here’s a brief comparison of the two technologies
Sharing your data on the web should be easy and effective.
You want to spend your time on analysing data and producing results, right? Presentation is important but the easier the better.
Both Mercury and Voilà are tools that will convert your notebook into an interactive web app — automatically. We are going at look at which is easier and/or better.
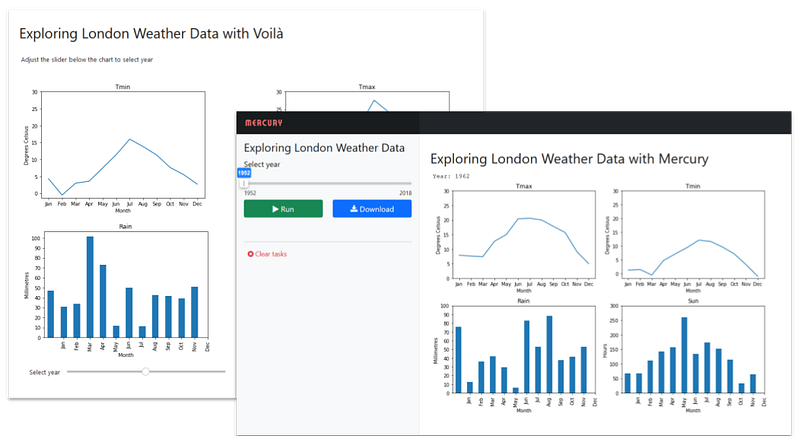
To illustrate the differences between using Mercury or Voilà, I’m going to go through a simple application to produce some interactive graphs from a data set.
There will be two versions: the first is a straightforward notebook that we will convert into an interactive app using the Mercury framework; the second uses ipywidgets, so the interaction is built in to the notebook and it is served as a web page using Voilà.
We’ll then consider which is the better approach.
The application is simple, read the weather data for London from a csv and produce an app that displays charts for the four values, maximum temperature, minimum temperature, rainfall and hours of sunshine, per month for a selected year. The year is selected with a slider control.
Mercury
The first approach is to use Mercury. Mercury takes any ordinary Jupyter notebook and transforms it into a web app.
To include interaction you need to define widgets in a special raw cell at the beginning of the notebook. Here is the one that I have created for this article:
---
title: Exploring London Weather Data
description: Use Mercury to make a web app from a Jupyter notebook
show-code: False
params:
   year:
      input: slider
      label: Select year
      value: 1952
      min: 1952
      max: 2018
---
After some descriptive value definitions is a params section. This specifies that the variable year is bound to an input control and defines some values for the control (which are self-explanatory).
This has to be the first cell in the notebook; the second cell should define the variable(s) that have controls bound to them. In our case:
year = 1952Then come the rest of the notebook — I’ve written the whole app in a single code cell.
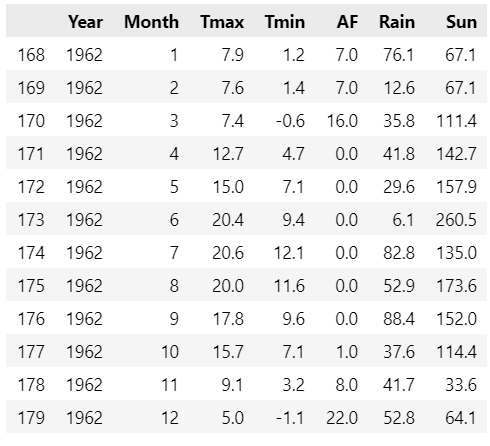
As you can see in the code above, we read a csv file into a Pandas dataframe. The data starts in the year 1948 and goes up to 2018. Here is the data for 1962:
We then plot the charts using a subset of the dataframe that is selected by the value of year:
weather[weather['Year']==year].plot(…)
If you run the notebook you will get the charts displayed for 1952, the initial value we set for year.
However, if we create a Mercury app from the notebook and run that in our web browser we will see the interactive app.
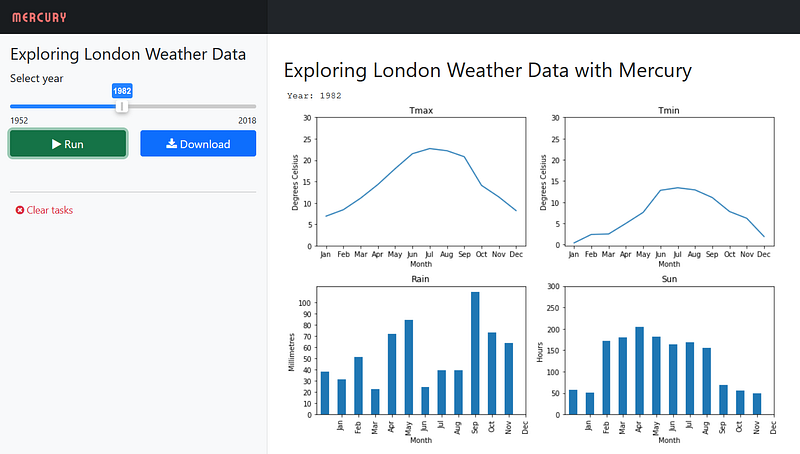
The slider is displayed in the left panel and the graphs appear in the right one. To change the value of the year we move the slider and then hit the Run button, whereupon a new set of graphs will be displayed.
To create the Mercury app you need to install Mercury, of course,
pip install mljar-mercuryor
conda install -c conda-forge mljar-mercuryAnd in a terminal window navigate to the directory where you notebook is and run the command:
mercury runThe app will be running a local host here: 127.0.0.1:8000
Voilà
The second approach is to use Voilà to create a web app from a notebook and for this we will need to use ipywidgets to create the interactive control.
So, no special cells here and the entire code (which I admit is a bit ugly) is in a single cell:
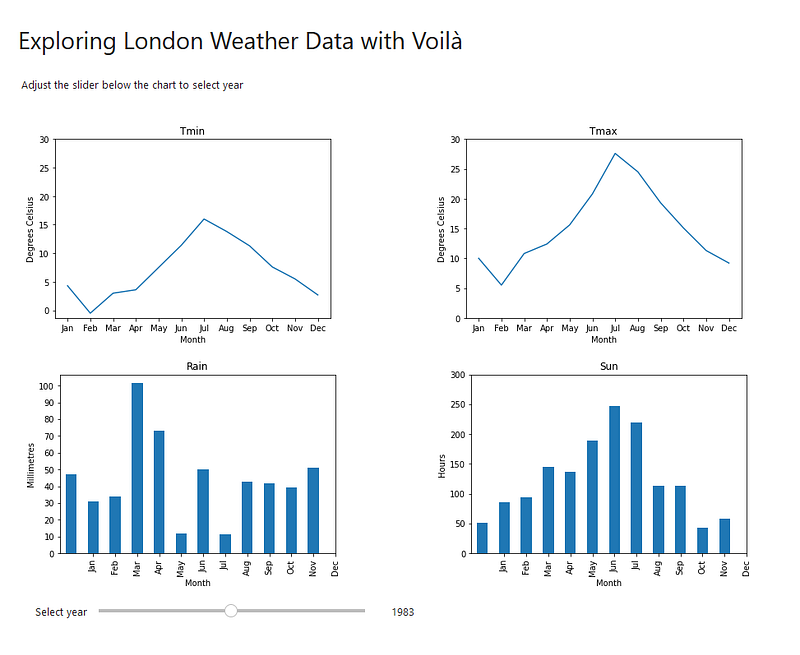
Four widgets are defined for the charts and one for a header, and these are displayed in a 4 x 2 grid. Each of the chart widgets is bound to a slider widget which is defined on line 38 and displayed in the last grid location.
The result is a notebook which is interactive in itself but when transformed with Voilà becomes a stand-alone web app.
To convert the notebook you will need to install Voilà:
pip install voilaOr
conda install -c conda-forge voilaIn the notebook directory run the command voila in a terminal window and in the web page that pops up navigate to the notebook.
I’d like to think the inelegance of the code is due to the constraints of ipwidgets — you may have a different opinion!
Which to choose
So which is the best approach?
At first, my inclination was to favour Voilà because the interaction is immediate, as you move the slider the charts change immediately. Very nice. But the disadvantage is that (even in this very simple app) the code is more complex than it otherwise might be and this is entirely due to the use of ipwidgets.
The Mercury approach is to add that extra cell that defines the controls and binds them to variables in the notebook. A disadvantage is that the notebook itself is not interactive (the app, of course, is) but it has the benefit of being much simpler as the notebook is focussed what is important, the data analysis, and not the interaction.
The Mercury solution also requires a button press to affect a change. But is that a disadvantage — maybe flashy dynamic charts are a bit overrated.
I’m not going to make up my mind on this. You can download the code (see the links below) and look at the product web sites (also linked to, below) and decide for yourself.
Instructions on how to deploy the apps to public web hosts, such as Heroku, are on the Voilà and Mercury websites.
As ever thanks for reading and if you would like to know when I publish new articles, please consider signing up for an email alert below or subscribing to my free occasional newsletter on Substack.
If you are not already a Medium subscriber, how about signing up so you can read as many articles as you like for $5 a month. Sign up here and I’ll earn a small commission.
Code
The three files that you need are in my Github repository and the direct links are here:
References
The web sites for the three technologies that I have used are below:


