
ELK By Karthick Dkk
How to Set Up ELK: A Beginner’s to Pro Guide (Part-1)
Get your logging and analytics game strong with ELK Stack — Let’s Make It Production-Ready!
What is ELK and Why Should You Care?
If you’re a DevOps engineer or someone responsible for system monitoring, you’ve probably heard of ELK — the powerhouse trio of Elasticsearch, Logstash, and Kibana. ELK is like the Avengers of the logging world.
If you’re not a member of Medium, Please check here
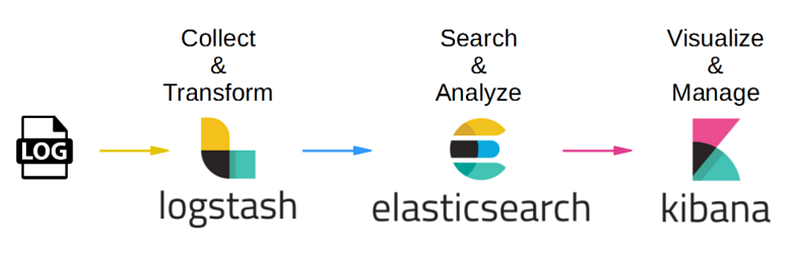
Elasticsearch does the searching, Logstash does the log collection and parsing, and Kibana presents it all in beautiful visual dashboards.
In this blog, we’ll walk through how to set up ELK for production, step-by-step, so you can start analyzing your logs, monitoring performance, and troubleshooting issues faster than ever!
1. Why Do You Need ELK in Production?
Imagine you’re a detective. Your servers are giving you hints (logs), but they’re scattered in multiple places, and there’s no easy way to correlate them. That’s where ELK comes in.
- Elasticsearch is the search engine that will index and store your logs in a fast, scalable way.
- Logstash will help you collect, parse, and transform logs from various sources (like your servers, databases, or applications).
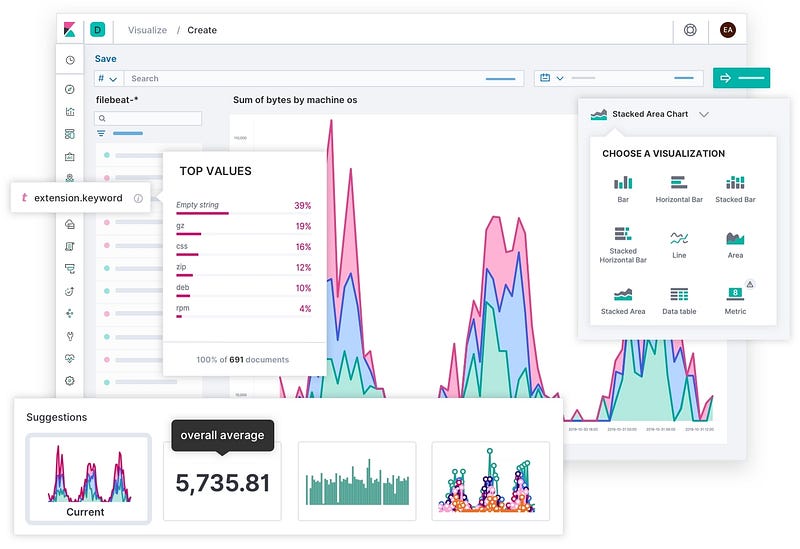
- Kibana makes it easy to visualize your log data, letting you spot trends, errors, and issues quickly.
Without ELK, managing logs at scale can be like trying to find a needle in a haystack, especially when things go wrong!
2. Setting Up Elasticsearch: The Search Powerhouse

2.1 Install Elasticsearch
To begin, let’s get Elasticsearch running. This is where your logs will be stored, indexed, and searched.
Using Repo: (ubuntu)
wget -qO - https://artifacts.elastic.co/GPG-KEY-elasticsearch | sudo gpg --dearmor -o /usr/share/keyrings/elasticsearch-keyring.gpg
sudo apt-get install apt-transport-https
echo "deb [signed-by=/usr/share/keyrings/elasticsearch-keyring.gpg] https://artifacts.elastic.co/packages/8.x/apt stable main" | sudo tee /etc/apt/sources.list.d/elastic-8.x.list
sudo apt-get update && sudo apt-get install elasticsearch
Download and install the Debian package manually
sudo apt update -y
sudo apt install -y openjdk-11-jre-headless  # Elasticsearch requires Java, so let's install that first
wget https://artifacts.elastic.co/downloads/elasticsearch/elasticsearch-7.10.0-amd64.deb
sudo dpkg -i elasticsearch-7.10.0-amd64.deb
sudo systemctl enable elasticsearch --now
How to download a specific version of Elasticsearch: (Optional)
Here is a past release: download 7–16–3
wget https://artifacts.elastic.co/downloads/elasticsearch/elasticsearch-7.16.3-amd64.deb2.2 Test Elasticsearch
Once installed, check if Elasticsearch is running by visiting http://localhost:9200 from a web browser or curl:
curl -X GET "localhost:9200/"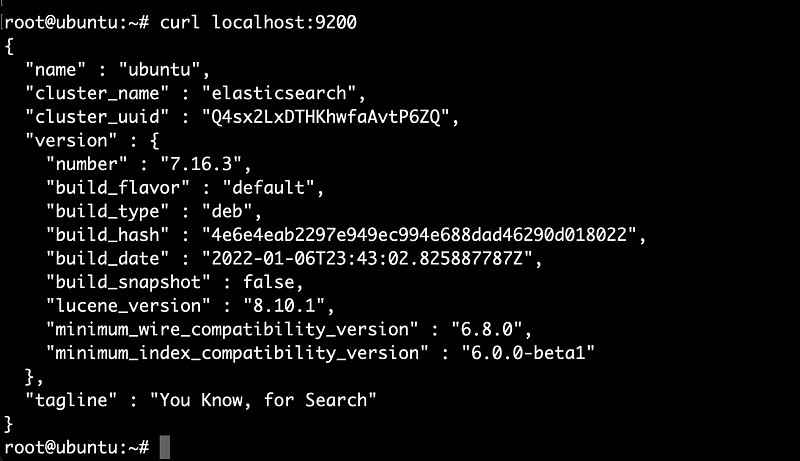
You should see JSON output with Elasticsearch details. If you see something like You Know, For Search, then it's working! 🎉
Note: check out for more Elasticsearch
2.3 Nginx for Revers proxy: (Optional)
Install nginx to expose the elasticsearch to outside the system with proxy.
Edit /etc/nginx/conf.d/elasticsearch.conf
server {
    listen 9800;   # <-- use any port
    server_name your_domain_or_ip; # <-- your domain name

    location / {
        proxy_pass http://localhost:9200; # <-- Elasticsearch url
        proxy_set_header Host $host;
        proxy_set_header X-Real-IP $remote_addr;
        proxy_set_header X-Forwarded-For $proxy_add_x_forwarded_for;

        # Increase buffer and timeout settings for Elasticsearch
        proxy_buffer_size 128k;
        proxy_buffers 4 256k;
        proxy_busy_buffers_size 256k;
        proxy_read_timeout 90;

        # Optional: Allow CORS (useful for testing or external tools)
        add_header Access-Control-Allow-Origin "*";
        add_header Access-Control-Allow-Methods "GET, POST, OPTIONS";
        add_header Access-Control-Allow-Headers "DNT,Authorization,Content-Type,If-Modified-Since";
    }
}
Reload nginx:
# Verify the Config
nginx -t
# Reload the service
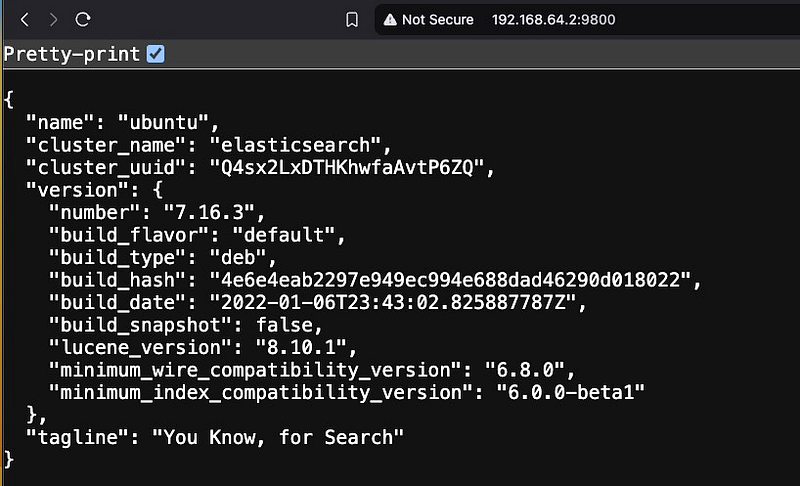
systemctl reload nginxCheck the URL, you will see the same output as below.
Elasticsearch logs:
Verify the logs, it started without any error.
# Check logs
journalctl -fu elasticsearch

or

tail -f /var/log/elasticsearch/elasticsearch.log
Note: Verify the log location in /etc/elasticsearch/elasticsearch.yml ( check path.logs: /var/log/elasticsearch )
3. Installing Logstash: Log Collection and Transformation

3.1: Install Logstash
Logstash is the tool that pulls in logs from various sources and sends them to Elasticsearch.
sudo apt update
sudo apt install logstash
Specific Version: (Optional)
wget https://artifacts.elastic.co/downloads/logstash/logstash-7.16.3-amd64.deb

dpkg -i logstash-7.16.3-amd64.deb
3.2: Configure Logstash Pipeline to send logs to Elasticseach
Now, let’s create a simple pipeline to collect logs. Here’s a basic configuration:
sudo nano /etc/logstash/conf.d/sample.conf
input {
  file {
    path => "/var/log/*.log"
    start_position => "beginning"
  }
}

# filter {
#  grok {
#        Your log filter options here
#  }
# }

output {
  elasticsearch {
    hosts => ["http://localhost:9200"]
    index => "ubuntu_logs"
  }
}
This configuration does the following:
- It reads all logs in
/var/log/*.log.
Note: Make sure logstash has access to read var/log/*.log
chmod 775 /var/log/*.log
- It uses
grokto parse log entries.(Optional) - It sends the logs to Elasticsearch in an index called ubuntu
_logs.
3.3: Start Logstash
To apply this configuration and start collecting logs, run:
sudo systemctl start logstash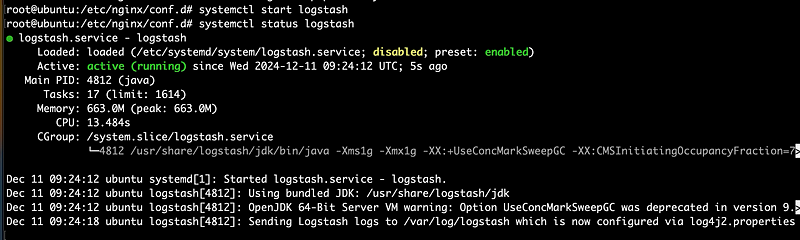
Logstash logs:
Verify the logs, it started without any error.
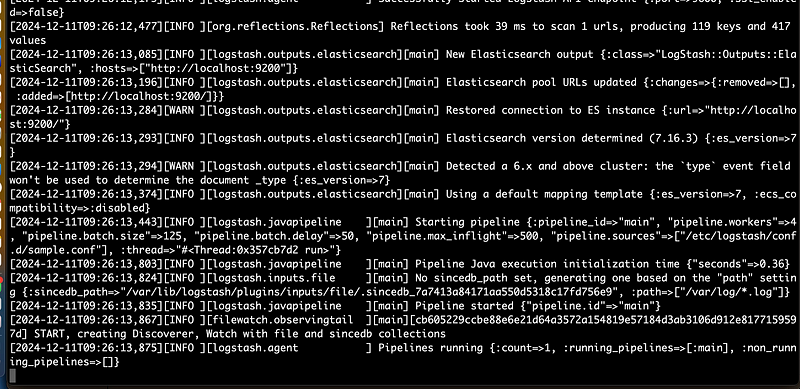
# Check logs
journalctl -fu logstash

or

tail -f /var/log/logstash/logstash-plain.log
Note: Verify the log location in /etc/logstash/logstash.yml [check path.logs: /var/log/logstash ]
Once Logstash successfully started we can see like below output.
“ Pipelines running : { court => } : running_pipelinses=>[:main] ….“
4. Setting Up Kibana: Visualizing Logs with Style
Kibana is where the magic happens — turning raw logs into neat graphs and dashboards.

4.1: Install Kibana
sudo apt update -y
sudo apt install kibana
Specific version:(optional)
wget https://artifacts.elastic.co/downloads/kibana/kibana-7.16.3-arm64.deb
dpkg -i kibana-7.16.3-arm64.deb
4.2: Configure Kibana to Connect to Elasticsearch
Edit the Kibana configuration file (/etc/kibana/kibana.yml) to point to your Elasticsearch instance:
sudo nano /etc/kibana/kibana.yml
Change the following line:
server.host: "192.168.64.2"                    # <-- server IP here
elasticsearch.hosts: ["http://localhost:9200"] # <-- ES URL here
4.3: Start Kibana
Now, start Kibana:
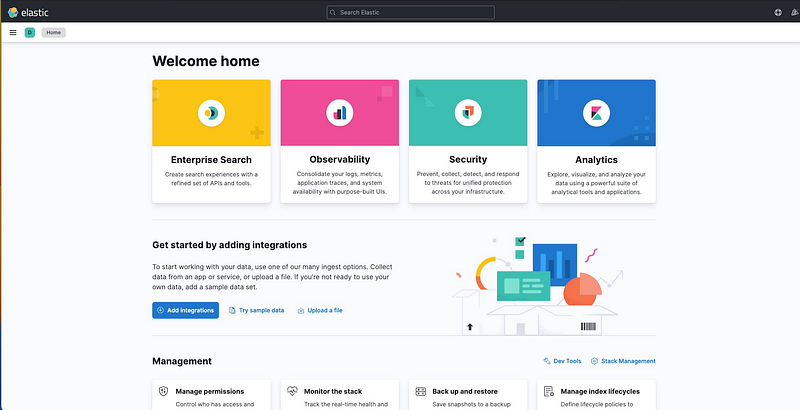
sudo systemctl start kibanaVisit http://localhost:5601 in your browser to access Kibana. You should see a beautiful dashboard waiting for your logs!
Configure Kibana :
Index:
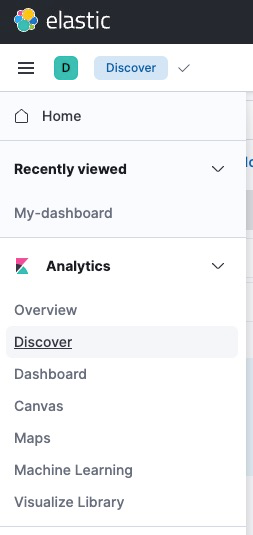
- Click Discover and create an index pattern
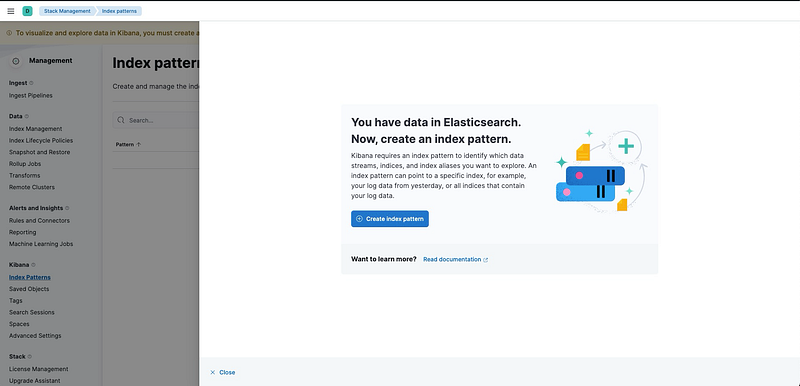
Name: ubuntu_logs , Timestamp field choose timestamp
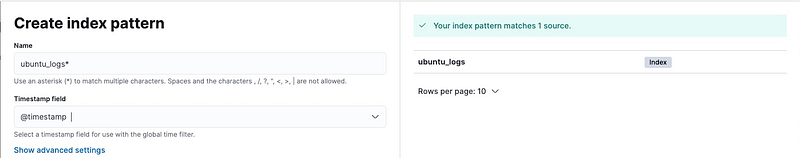
Note: index name same as elasticsearch index name.
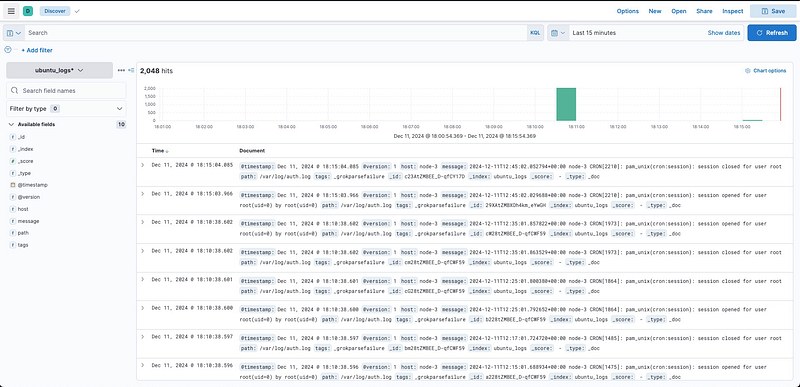
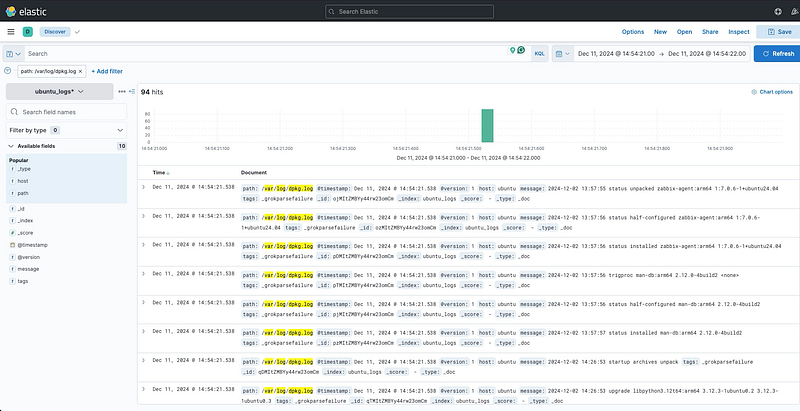
Once you add an Index on Kibana, you can view your index in the Discover field.
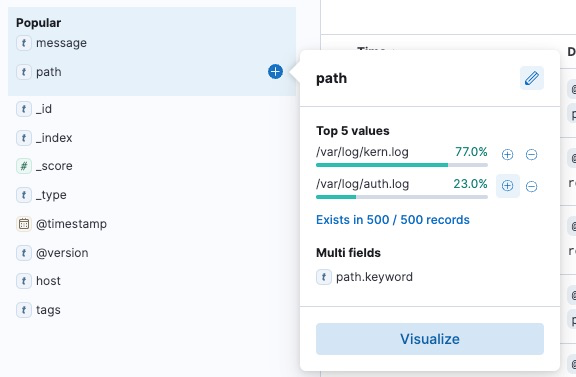
Filter Type: path click + symbol
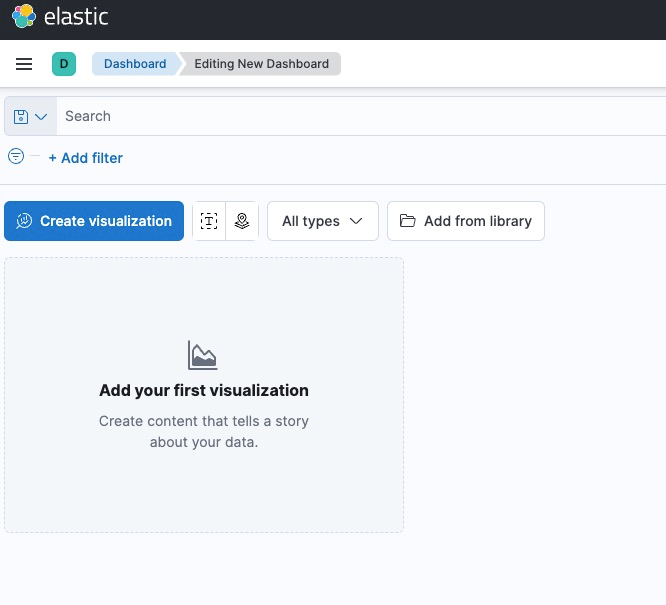
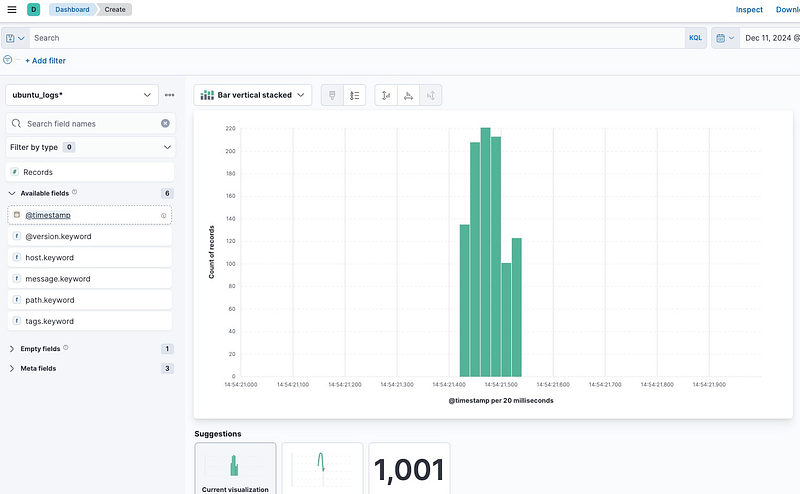
Dashboard:
- Now create a new Dashboard → Create Visualization
- Select the available fields, drag and drop to the right side.
- Here I choosed Records
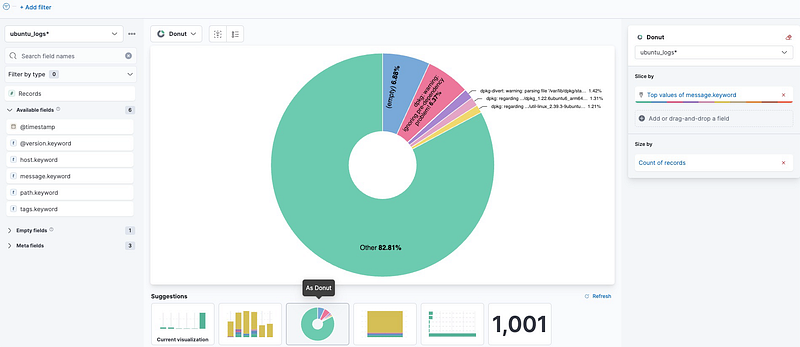
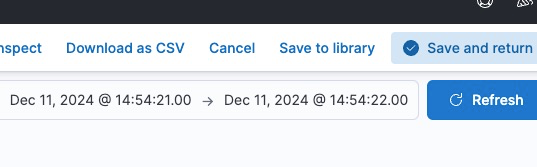
- Now choose the convenient the visualization on bottom tab, and Click Save and Return.
2. Add one more for timestamp fields
- Then Save the Dashboard with my-dashboard. And Go to the Dashboard Tab.
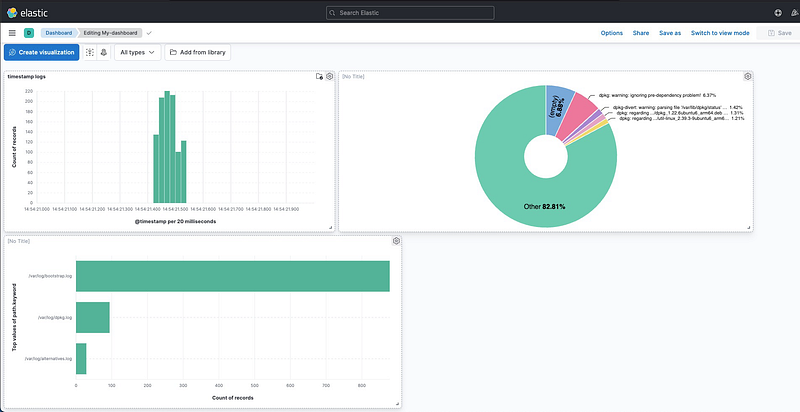
Same like above you can create multiple dashboards as per your wish.
5. Pro Tips:
Version Compatibility
- It is highly recommended to use the same version of Elasticsearch, Logstash, and Kibana (ELK Stack) to ensure compatibility and avoid potential issues.
- Minor version differences (like 8.2.0 vs. 8.2.1) are usually fine, but sticking to the exact version is safest!
- Elastic provides an official Compatibility Matrix for Elasticsearch, Logstash, and Kibana.
- Before upgrading any component, refer to this matrix to ensure version alignment.
Production-Ready ELK Setup
- Cluster Elasticsearch for Scalability: In production, one Elasticsearch node is rarely enough. Set up a cluster of nodes to distribute the load. Use Elastic’s official documentation for detailed steps.
- Logstash Performance Tuning: If you’re collecting logs from many sources, Logstash can become a bottleneck. Use multiple pipelines and optimize filter processing with the
mutateplugin. - Use Index Lifecycle Management (ILM): To prevent your Elasticsearch from getting overwhelmed with data, use ILM to automatically delete or archive old logs.
- Security: Use Elasticsearch’s built-in security features, like encryption and user authentication, to keep your data safe in production.
ELK for the Win!
Setting up ELK for production might seem daunting at first, but once you have it up and running, you’ll wonder how you ever managed without it. By centralizing and visualizing your logs, you can monitor your infrastructure like a pro, troubleshoot faster, and even predict issues before they arise.
So, what are you waiting for? Start logging and analyzing your data today with Elasticsearch, Logstash, and Kibana!
The very next blog will explore the Multi-node ELK setup.
Happy logging! 🖥️📊
Do you have more tips to add or horror stories to share? Drop them in the comments!
DevSecOps — Community 🚀
Thank you for being a part of the DevSecOps — Community community! Before you go:
- Be sure to clap and follow ️ Karthick Dkk ️️
- Follow: | LinkedIn | Newsletter | LinkedIn Groups | GitHub
- More content at DevSecOps — Community


