avatarSiméon Ferez

Free AI web copilot to create summaries, insights and extended knowledge, download it at here

6093

Abstract

<span class="hljs-keyword">import</span> pandas <span class="hljs-keyword">as</span> pd</pre></div><div id="826d"><pre>df=pd<span class="hljs-selector-class">.DataFrame</span>(client<span class="hljs-selector-class">.get_all_tickers</span>()) df=df<span class="hljs-selector-class">.set_index</span>(<span class="hljs-string">"symbol"</span>) df<span class="hljs-selector-attr">[<span class="hljs-string">"price"</span>]</span>=df<span class="hljs-selector-attr">[<span class="hljs-string">"price"</span>]</span><span class="hljs-selector-class">.astype</span>(<span class="hljs-string">"float"</span>) df.index=df<span class="hljs-selector-class">.index</span><span class="hljs-selector-class">.astype</span>(<span class="hljs-string">"string"</span>)</pre></div><div id="0844"><pre><span class="hljs-function"><span class="hljs-title">print</span><span class="hljs-params">(df)</span></span></pre></div><p id="4f81">Here is the output table:</p><div id="352a"><pre><span class="hljs-attribute">symbol price</span></pre></div><div id="91bb"><pre>ETHBTC <span class="hljs-number">0.073483</span> LTCBTC <span class="hljs-number">0.003261</span> BNBBTC <span class="hljs-number">0.008944</span> NEOBTC <span class="hljs-number">0.000749</span> QTUMETH <span class="hljs-number">0.003475</span> ... ... NUAUD <span class="hljs-number">1.227500</span> NURUB <span class="hljs-number">65.840000</span> REEFTRY <span class="hljs-number">0.353900</span> REEFBIDR <span class="hljs-number">521.200000</span> SHIBDOGE <span class="hljs-number">0.000238</span></pre></div><p id="2bb9">To isolate a specific price for a precise asset just use:</p><div id="0d50"><pre><span class="hljs-keyword">print</span>(df.<span class="hljs-keyword">loc</span>[<span class="hljs-comment">"BTCUSDT])</span></pre></div><p id="e43f">Output:</p><div id="38ea"><pre><span class="hljs-attribute">price</span> <span class="hljs-number">62228</span>.<span class="hljs-number">99</span> <span class="hljs-attribute">Name</span>: BTCUSDT, dtype: float64</pre></div><h2 id="376c">Get Historical Price</h2><p id="1cf9">This function is crucial if you want to have the historic prices of a specific asset to backtest a strategy or just plot it on a graph. We will cover how to backtest strategy to find the best parameters in a future article.</p><p id="c760">To execute this function we will specify an asset, a start date, an end date, and a timeframe.</p><p id="2624">The timeframe will be the delta between the two price data.</p><div id="594c"><pre><span class="hljs-keyword">import</span> pandas <span class="hljs-keyword">as</span> pd</pre></div><div id="27f8"><pre><span class="hljs-attribute">asset</span><span class="hljs-operator">=</span><span class="hljs-string">"BTCUSDT"</span> <span class="hljs-attribute">start</span><span class="hljs-operator">=</span><span class="hljs-string">"2021.10.1"</span> <span class="hljs-attribute">end</span><span class="hljs-operator">=</span><span class="hljs-string">"2021.11.1"</span> <span class="hljs-attribute">timeframe</span><span class="hljs-operator">=</span><span class="hljs-string">"1d"</span></pre></div><div id="0574"><pre>df =pd.DataFrame(<span class="hljs-keyword">assert</span>,timeframe,<span class="hljs-keyword">start</span>,<span class="hljs-keyword">end</span>)</pre></div><p id="9133">This will return a table with all the data of the asset (BTC/USDT) between the 1st October 2021 and 1st November 2021 with a 1-day timeframe.</p><p id="a0a1">To clean a bit and have a nice Table I suggest adding these few lines. These will select the columns that are interesant in the DataFrame and convert the data in a readable format.</p><div id="2948"><pre><span class="hljs-attr">df</span>= pd.DataFrame(client.get_historical_klines(asset, timeframe,start,end))</pre></div><div id="8285"><pre><span class="hljs-attr">df</span>=df.iloc[:,:<span class="hljs-number">6</span>] <span class="hljs-attr">df.columns</span>=[<span class="hljs-string">"Date"</span>,<span class="hljs-string">"Open"</span>,<span class="hljs-string">"High"</span>,<span class="hljs-string">"Low"</span>,<span class="hljs-string">"Close"</span>,<span class="hljs-string">"Volume"</span>] <span class="hljs-attr">df</span>=df.set_index(<span class="hljs-string">"Date"</span>) <span class="hljs-attr">df.index</span>=pd.to_datetime(df.index,unit=<span class="hljs-string">"ms"</span>) <span class="hljs-attr">df</span>=df.astype(<span class="hljs-string">"float"</span>)</pre></div><div id="994b"><pre><span class="hljs-function"><span class="hljs-title">print</span><span class="hljs-params">(df)</span></span></pre></div><p id="3ac3">You have now a nice Table containing The Date, The Open price, High, Low, Close price and Volume executed. This data is crucial to make a strategy and calculate some technical indicators, we will use them in a near future.</p><p id="50b4">Here is an example of the output :</p><div id="7400"><pre><span class="hljs-built_in">Date</span> <span class="hljs-keyword">Open</span> High Low <span class="hljs-built_in">Close</span> <span class="hljs-built_in">Volume</span></pre></div><div id="c71e"><pre><span class="hljs-attribute">2021</span>-<span class="hljs-number">10</span>-<span class="hljs-number">01</span> <span class="hljs-number">43820</span>.<span class="hljs-number">01</span> <span class="hljs-number">48495</span>.<span class="hljs-number">00</span> <span class="hljs-number">43283</span>.<span class="hljs-number">03</span> <span class="hljs-number">48141</span>.<span class="hljs-number">61</span> <span class="hljs-number">66244</span>.<span class="hljs-number">874920</span> <span class="hljs-attribute">2021</span>-<span class="hljs-number">10</span>-<span class="hljs-number">02</span> <span class="hljs-number">48141</span>.<span class="hljs-number">60</span> <span class="hljs-number">48336</span>.<span class="hljs-number">59</span> <span class="hljs-number">47430</span>.<span class="hljs-number">18</span> <span class="hljs-number">47634</span>.<span class="hljs-number">90</span> <span class="hljs-number">30508</

Options

span>.<span class="hljs-number">981310</span> <span class="hljs-attribute">2021</span>-<span class="hljs-number">10</span>-<span class="hljs-number">03</span> <span class="hljs-number">47634</span>.<span class="hljs-number">89</span> <span class="hljs-number">49228</span>.<span class="hljs-number">08</span> <span class="hljs-number">47088</span>.<span class="hljs-number">00</span> <span class="hljs-number">48200</span>.<span class="hljs-number">01</span> <span class="hljs-number">30825</span>.<span class="hljs-number">056010</span> <span class="hljs-attribute">2021</span>-<span class="hljs-number">10</span>-<span class="hljs-number">04</span> <span class="hljs-number">48200</span>.<span class="hljs-number">01</span> <span class="hljs-number">49536</span>.<span class="hljs-number">12</span> <span class="hljs-number">46891</span>.<span class="hljs-number">00</span> <span class="hljs-number">49224</span>.<span class="hljs-number">94</span> <span class="hljs-number">46796</span>.<span class="hljs-number">493720</span> <span class="hljs-attribute">2021</span>-<span class="hljs-number">10</span>-<span class="hljs-number">05</span> <span class="hljs-number">49224</span>.<span class="hljs-number">93</span> <span class="hljs-number">51886</span>.<span class="hljs-number">30</span> <span class="hljs-number">49022</span>.<span class="hljs-number">40</span> <span class="hljs-number">51471</span>.<span class="hljs-number">99</span> <span class="hljs-number">52125</span>.<span class="hljs-number">667930</span> <span class="hljs-attribute">2021</span>-<span class="hljs-number">10</span>-<span class="hljs-number">06</span> <span class="hljs-number">51471</span>.<span class="hljs-number">99</span> <span class="hljs-number">55750</span>.<span class="hljs-number">00</span> <span class="hljs-number">50382</span>.<span class="hljs-number">41</span> <span class="hljs-number">55315</span>.<span class="hljs-number">00</span> <span class="hljs-number">79877</span>.<span class="hljs-number">545181</span> <span class="hljs-attribute">2021</span>-<span class="hljs-number">10</span>-<span class="hljs-number">07</span> <span class="hljs-number">55315</span>.<span class="hljs-number">00</span> <span class="hljs-number">55332</span>.<span class="hljs-number">31</span> <span class="hljs-number">53357</span>.<span class="hljs-number">00</span> <span class="hljs-number">53785</span>.<span class="hljs-number">22</span> <span class="hljs-number">54917</span>.<span class="hljs-number">377660</span> <span class="hljs-attribute">2021</span>-<span class="hljs-number">10</span>-<span class="hljs-number">08</span> <span class="hljs-number">53785</span>.<span class="hljs-number">22</span> <span class="hljs-number">56100</span>.<span class="hljs-number">00</span> <span class="hljs-number">53617</span>.<span class="hljs-number">61</span> <span class="hljs-number">53951</span>.<span class="hljs-number">43</span> <span class="hljs-number">46160</span>.<span class="hljs-number">257850</span> <span class="hljs-attribute">2021</span>-<span class="hljs-number">10</span>-<span class="hljs-number">09</span> <span class="hljs-number">53955</span>.<span class="hljs-number">67</span> <span class="hljs-number">55489</span>.<span class="hljs-number">00</span> <span class="hljs-number">53661</span>.<span class="hljs-number">67</span> <span class="hljs-number">54949</span>.<span class="hljs-number">72</span> <span class="hljs-number">55177</span>.<span class="hljs-number">080130</span></pre></div><h2 id="e87a">Visualize the Data</h2><p id="6d70">If you want to easily visualize the DataFrame that you just recover from the Binance API, this is the easy way :</p><p id="df52">Install and import the mplfinance library :</p><div id="acfc"><pre>pip <span class="hljs-keyword">install</span> mplfinance</pre></div><p id="aa71">And then import it in your python code. Then you just have to plot the DataFrame using the mpl library to have a nice graph of the asset, if you would like to change the design of the graph just refer to the documentation of mplfinance library.</p><div id="ae46"><pre><span class="hljs-keyword">import</span> mplfinance <span class="hljs-keyword">as</span> mpl</pre></div><div id="638f"><pre><span class="hljs-comment">#Insert the code for the creation of the DataFrame that we see earlier</span></pre></div><div id="d6e0"><pre>mpl.plot(<span class="hljs-built_in">df</span>, <span class="hljs-built_in">type</span>=<span class="hljs-string">'candle'</span>)</pre></div><p id="01e8">Here is the output and the beautiful graph:</p><figure id="8f58"><img src="https://cdn-images-1.readmedium.com/v2/resize:fit:800/1*yaUytkWsJQiXGbBzH0JeGg.png"><figcaption>A simple graph with mplfinance</figcaption></figure><p id="db2b">In this option you can easily add some technical indicators like some simple moving average and the volume graph with:</p><div id="3a4d"><pre>mpl.plot(df, <span class="hljs-attribute">type</span>=<span class="hljs-string">'candle'</span>, <span class="hljs-attribute">volume</span>=<span class="hljs-literal">True</span>, <span class="hljs-attribute">mav</span>=7)</pre></div><figure id="cdc2"><img src="https://cdn-images-1.readmedium.com/v2/resize:fit:800/1*OdwOhWAo8q-G1ziFcksVjQ.png"><figcaption>Graph with volume and SMA7 with mplfinance</figcaption></figure><h1 id="09eb">Conclusion</h1><p id="f5a0">We have seen how to create API keys and connect to Binance API using Python.</p><p id="ecf7">We can now easily have the historical data of an asset to backtest a strategy, we will see how to do this in a future article.</p><p id="a792">Follow this guide to easily be able to create your trading bot.</p><p id="dab4">Thanks for reading.</p><h1 id="3e1e">Learn more</h1><h2 id="80c5">How to Develop an Arbitrage Betting Bot Using Python</h2><figure id="dbd1"><img src="https://cdn-images-1.readmedium.com/v2/resize:fit:800/0*saj_gZxOl9gqf_n4.png"><figcaption></figcaption></figure><p id="baa9">© All rights reserved, Siméon FEREZ</p><p id="c566"><i>More content at <a href="http://plainenglish.io/">plainenglish.io</a></i></p></article></body>

How to Set up and Use Binance API with Python

Part I: A step by step tutorial to set up and use Binance API in Python to backtest strategies, plot data, or live trade using predefined rules.

  • Introduction
  • Create your Binance API Key
  • Connect to Binance client using Python
  • Use Binance API
  • Get all coins prices
  • Get historical prices
  • Visualize Data
  • Conclusion

Introduction

A Step by Step tutorial to set up and use Binance API in Python to backtest strategies, plot data, or live trade using predefined rules.

This part (Part I) will cover how to create API keys, connect to the Binance API and get the current price of the assets available to trade. We will also see how to have the historical data to later backtest strategies.

Part II will cover how to place a spot order and future order. How to close these trades and have information about them.

Part III will cover how to create a live stream data flow to be able to have each second the new live price of a specific asset.

Create Your Binance Key

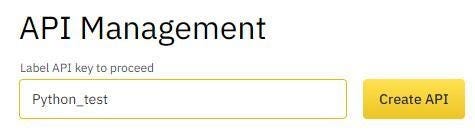
Connect to Binance and go to API management to create a key pair:

API Mangement in Binance

And create your API key pair:

Create the API key

Select the options you want and the restriction you want to use. Be careful to not share your API keys especially if your key has future or withdrawn enabled.

Options of your API key

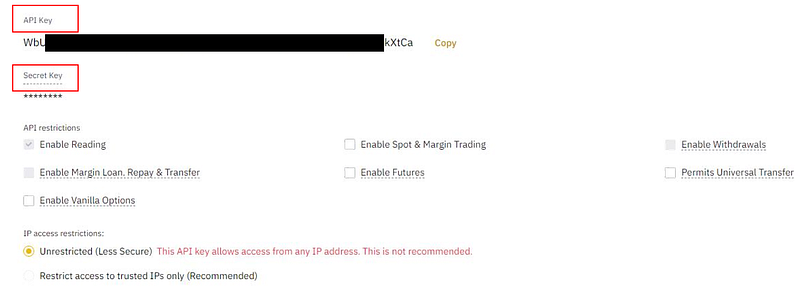
The important information you will need is your API Keys and your secret Keys. These two will be used in our python program.

Connect to Binance Client Using Python

Now that you have your key, you are ready for the next steps.

To use and manage Binance API easily we will use a python library. Install it with the following command:

pip install python-binance
#and then import it in your python file with
from binance.client import Client

Then we will import the library to the python file and connect it to the Binance client.

To connect to the client just define your API and secret key variable and execute the client function.

from python-binance import Client
api_key = "your api key"
api_secret = "your api secret key"
client=Client(api_key,api_secret)

To verify that your keys are correct and that you’re connected to Binance, execute this function that will ping the server.

If this returns an empty dictionary, this means that all is correct and that you are ready for the next steps.

print(client.ping())
#if it's return "{}" all is good, you're ready for next step

Using Binance API

Now we are connected to a Binance client. So we could play a bit with the API to have data about a specific asset to backtest a strategy, or just execute some trades.

Here are some useful functions that you may frequently use.

Get all coins tickers and price

This function will return a list with all the coins available to trade on the platform with their price.

info = client.get_all_tickers()

Example of output :

[{'symbol': 'ETHBTC', 'price': '0.07284200'}, {'symbol': 'LTCBTC', 'price': '0.00322200'}, {'symbol':'BNBBTC', 'price': '0.00885500'} ........]

To work with this data we’ll use the python library pandas to stock these in a DataFrame. This will facilitate the manipulation.

Just install and import pandas in the python document with:

pip install pandas

We will just add a few lines of code to select the data type of the columns, and add an index in the DataFrame.

import pandas as pd
df=pd.DataFrame(client.get_all_tickers())
df=df.set_index("symbol")
df["price"]=df["price"].astype("float")
df.index=df.index.astype("string")
print(df)

Here is the output table:

symbol  price
ETHBTC 0.073483
LTCBTC 0.003261
BNBBTC 0.008944
NEOBTC 0.000749
QTUMETH 0.003475
... ...
NUAUD 1.227500
NURUB 65.840000
REEFTRY 0.353900
REEFBIDR 521.200000
SHIBDOGE 0.000238

To isolate a specific price for a precise asset just use:

print(df.loc["BTCUSDT])

Output:

price 62228.99
Name: BTCUSDT, dtype: float64

Get Historical Price

This function is crucial if you want to have the historic prices of a specific asset to backtest a strategy or just plot it on a graph. We will cover how to backtest strategy to find the best parameters in a future article.

To execute this function we will specify an asset, a start date, an end date, and a timeframe.

The timeframe will be the delta between the two price data.

import pandas as pd
asset="BTCUSDT"
start="2021.10.1"
end="2021.11.1"
timeframe="1d"
df =pd.DataFrame(assert,timeframe,start,end)

This will return a table with all the data of the asset (BTC/USDT) between the 1st October 2021 and 1st November 2021 with a 1-day timeframe.

To clean a bit and have a nice Table I suggest adding these few lines. These will select the columns that are interesant in the DataFrame and convert the data in a readable format.

df= pd.DataFrame(client.get_historical_klines(asset, timeframe,start,end))
df=df.iloc[:,:6]
df.columns=["Date","Open","High","Low","Close","Volume"]
df=df.set_index("Date")
df.index=pd.to_datetime(df.index,unit="ms")
df=df.astype("float")
print(df)

You have now a nice Table containing The Date, The Open price, High, Low, Close price and Volume executed. This data is crucial to make a strategy and calculate some technical indicators, we will use them in a near future.

Here is an example of the output :

Date       Open     High     Low      Close    Volume
2021-10-01 43820.01 48495.00 43283.03 48141.61 66244.874920
2021-10-02 48141.60 48336.59 47430.18 47634.90 30508.981310
2021-10-03 47634.89 49228.08 47088.00 48200.01 30825.056010
2021-10-04 48200.01 49536.12 46891.00 49224.94 46796.493720
2021-10-05 49224.93 51886.30 49022.40 51471.99 52125.667930
2021-10-06 51471.99 55750.00 50382.41 55315.00 79877.545181
2021-10-07 55315.00 55332.31 53357.00 53785.22 54917.377660
2021-10-08 53785.22 56100.00 53617.61 53951.43 46160.257850
2021-10-09 53955.67 55489.00 53661.67 54949.72 55177.080130

Visualize the Data

If you want to easily visualize the DataFrame that you just recover from the Binance API, this is the easy way :

Install and import the mplfinance library :

pip install mplfinance

And then import it in your python code. Then you just have to plot the DataFrame using the mpl library to have a nice graph of the asset, if you would like to change the design of the graph just refer to the documentation of mplfinance library.

import mplfinance as mpl
#Insert the code for the creation of the DataFrame that we see earlier
mpl.plot(df, type='candle')

Here is the output and the beautiful graph:

A simple graph with mplfinance

In this option you can easily add some technical indicators like some simple moving average and the volume graph with:

mpl.plot(df, type='candle', volume=True, mav=7)
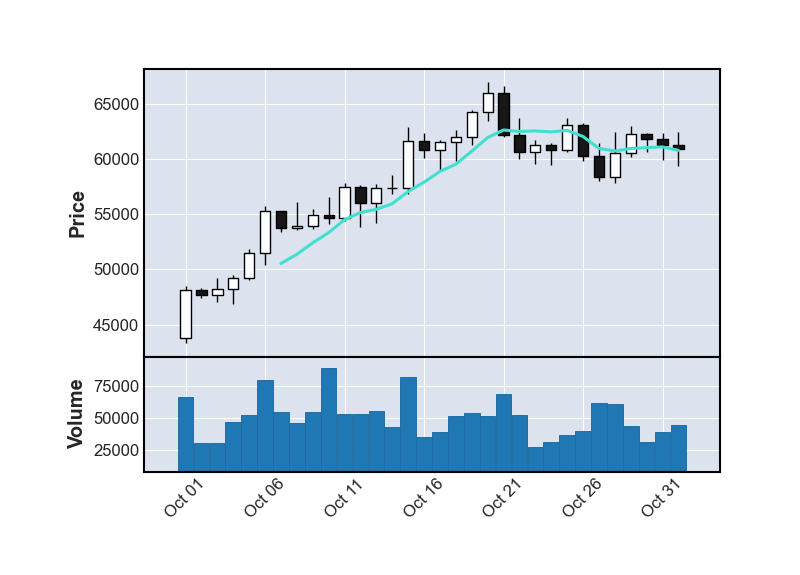
Graph with volume and SMA7 with mplfinance

Conclusion

We have seen how to create API keys and connect to Binance API using Python.

We can now easily have the historical data of an asset to backtest a strategy, we will see how to do this in a future article.

Follow this guide to easily be able to create your trading bot.

Thanks for reading.

Learn more

How to Develop an Arbitrage Betting Bot Using Python

© All rights reserved, Siméon FEREZ

More content at plainenglish.io

Python
Programming
Cryptocurrency
Binance
Trading
Recommended from ReadMedium