
Configure Prometheus Alertmanager to Send Email on Alert Firing
How to create Alerting Rules? Install and configure Alertmanager to send mail on alert firing.

Hello, We have seen how to create recording rules in Prometheus in my previous article. Let’s see what Alert rules are and how we can configure them in Prometheus.
What are Alerting Rules?
Alerting rules allow us to define alert conditions based on Prometheus expression language expressions and to send notifications about firing alerts to an external service. Whenever the alert expression results in one or more vector elements at a given point in time, the alert counts as active for these elements’ label sets.
How To Create Alerting Rules
Since we have Prometheus and node exporters running, we just have to add few alerting rules to the prometheus_rules.yml, the same place where we added the recording rules.
Here I have added 2 alerts under alert_rules, one to check if any of the instances are down and another one to check if the free disk space percentage goes less than 10%. To check if the rules have been added successfully without any syntactical errors, just run this command.
./promtool check rules prometheus_rules.yml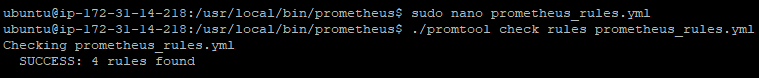
Once we have added these alert_rules to the prometheus_rules.yml, we need to restart the Prometheus service, so just run
sudo service prometheus restartFrom the above YAML file, we can see the expr field specifies the metric query and threshold under which this alert should fire, i.e. when the queue size is greater than 100.
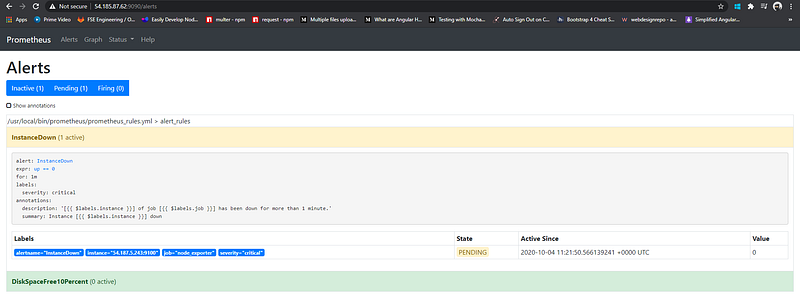
The for field is used to delay the alert from triggering, to avoid spurious alerts when the threshold is only reached for a short period of time before returning to normal. In this case, 1m means that if the instance goes down, the alert will be set to Pending and remain that way if it doesn’t recover. After 1minutes, it will be set to Firing and the relevant notifications will be triggered.
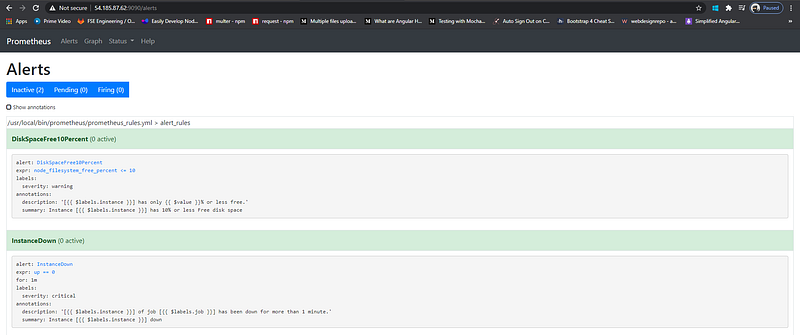
Once the alerting rules are added, we can see them on our dashboard as well. It shows the configuration of the rule along with the current status it is in.
Prometheus itself does not send the actual alert messages to users, this is the responsibility of the Alertmanager (deployed independently). When an alert reaches the Firing state, Prometheus notifies the Alertmanager, which in turn will route the alert to the right channel (e.g. Slack, Pagerduty…) and the right people.
Install Alertmanager
wget https://github.com/prometheus/alertmanager/releases/download/v0.21.0/alertmanager-0.21.0.linux-amd64.tar.gztar -xzf alertmanager-0.21.0.linux-amd64.tar.gzcd alertmanager-0.21.0.linux-amd64/cp -r . /usr/local/bin/alertmanagersudo vi/etc/systemd/system/alertmanager.serviceWe need to run the Alertmanager as a service, so paste the below code in alertmanager.service
[Unit]
Description=Prometheus Alert Manager Service
After=network.target
[Service]
Type=simple
ExecStart=/usr/local/bin/alertmanager/alertmanager \
--config.file=/usr/local/bin/alertmanager/alertmanager.yml
[Install]
WantedBy=multi-user.targetNow we can run the Alertmanager as a service.
sudo service alertmanager start
sudo service alertmanager status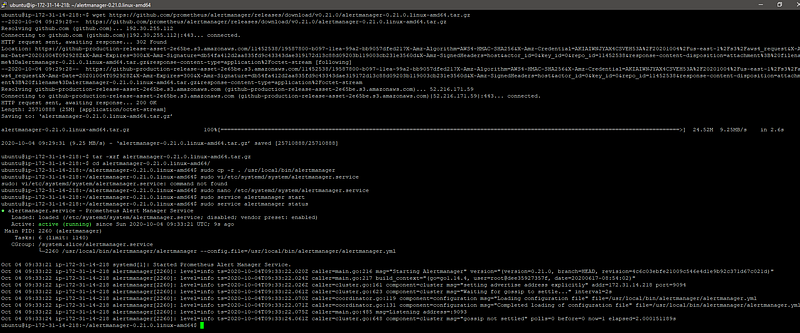
Configure Alertmanager
Now we need to configure Alertmanager to send us mails whenever an alert reaches the firing state. We need to add the below configuration in alertmanager.yml
sudo vi /usr/local/bin/alertmanager/alertmanager.ymlAdd your own mail ids and password, once that is done, we can check if the configuration has been updated successfully with the help of amtool by running this command.
/usr/local/bin/alertmanager/amtool check-config /usr/local/bin/alertmanager/alertmanager.yml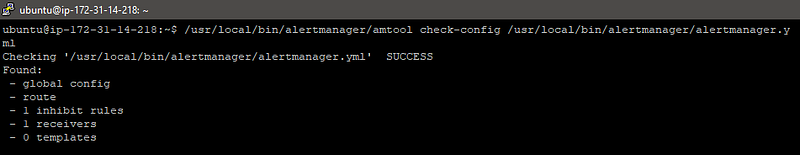
Still, the Alertmanager isn’t added to our Prometheus, we need to update our prometheus.yml file by adding the location of our Alertmanager.
Under alerting field we add our Alertmanager target and we need to restart the Prometheus service for the updated configurations to take effect and we can see the Alertmanager in our Prometheus dashboard under the status tab. Since our Alertmanager is running on 9093, we can access its dashboard to check the status of alerts in that port.
sudo service prometheus startTrigger Alert
Now the last part is to check if the Alertmanager is working by violating an alert rule. So since our alert rule is to check if all instances are up, so to violate this rule, I’ll bring down one of the node exporters.
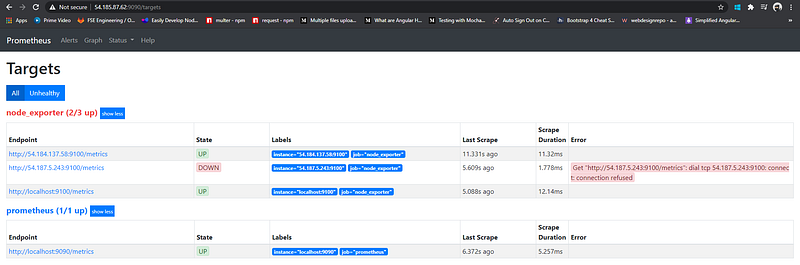
Since one of the node exporters is down, the alert should be in the pending state and if the instance is down for more than 1m then the alert goes into firing state and Alertmanager kicks in.
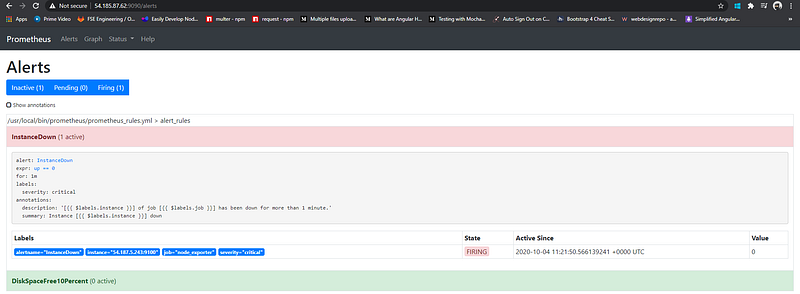
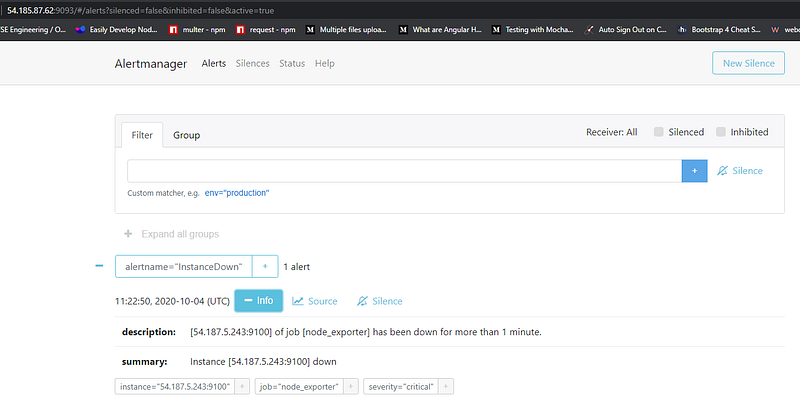
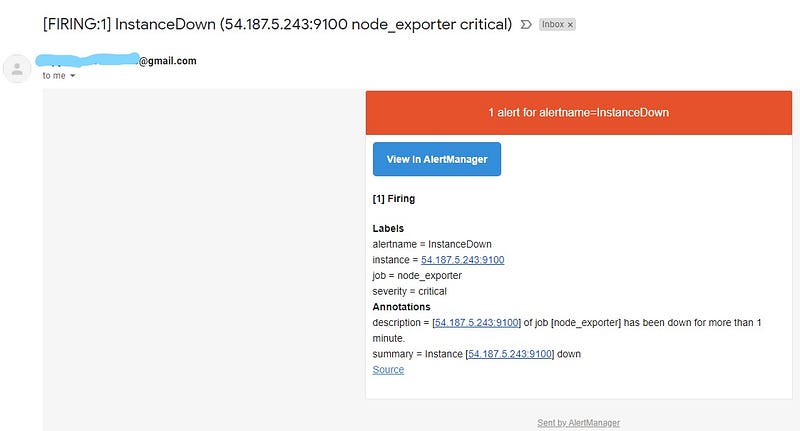
After 1min the alert goes into firing state and we can see that it is being reflected even in the Alertmanager dashboard. Since the alert is in firing state, we should get a mail regarding the alert on the mail-id that we have mentioned in the alertmanager.yml.
That sums up how we can add alert rules in Prometheus and how we can configure Alertmanager to send us a notification via mail on the alert being triggered. If you find it helpful, please drop some claps and feel free to share the article. This is Vinesh signing-off. Byeee 😋


