
How to Represent a Graph Data Structure in Python
Python representation of graph.

Graph is an important data structure studied in Computer Science. Graph theory is an equally important topic in both mathematics and Computer Science.
Representing a graph in a program means finding a way to store the graph in a computer’s memory. Which is a prerequisite to working with graphs in Computer Science.
In this article, I will discuss how to represent a graph using Python.
Table of Contents:· The Basics of Graph
· Two Types of Graph Representation
· Adjacency Matrix Representation
· Adjacency List Representation
∘ Adjacency list of a directed graph:
∘ Adjacency list of an undirected graph:
∘ Adjacency list of a graph with path costs:
· The Graph Class
· Take Input From File
· Conclusion
· Helpful ResourcesThe Basics of Graph
A graph is a non-linear data structure that consists of a set of nodes and edges. Nodes are also referred to as vertices. An edge is a path that connects two nodes.
If we consider the following graph:
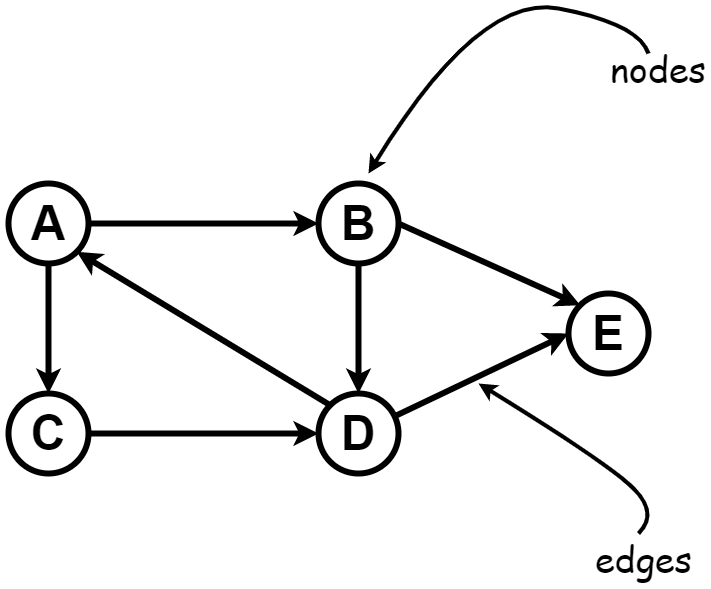
Here we have 5 nodes and 7 edges. The set of nodes/vertices, V = {A, B, C, D, E}, and the set of edges, E = {(A, B), (A, C), (B, D), (B, E), (C, D), (D, A), (D, E)}.
The set of edges indicates two neighbor nodes. (A, B) means there is a path between node A and node B. The arrow means we can go from node A to node B and not the other way. This kind of graph is called a directed graph.
The other kind of graph is an undirected graph. See the graph below:
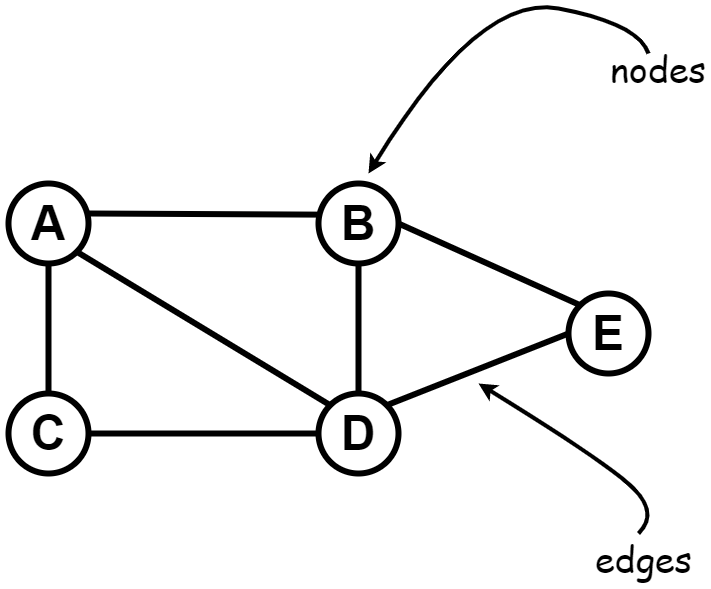
This is the same graph only without the arrows. Here edge(A, B) means we can go from A to B as well as from B to A.
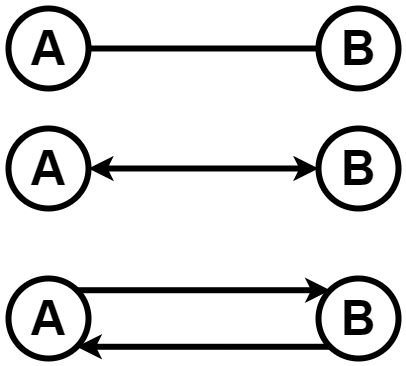
An undirected graph can also be referred to as a bidirectional graph. Because no arrow actually means arrows on both sides.
The cost of the paths can also be given in a graph. We can think of it as the cost of traveling from one city to another city. Cities are the nodes, the road that connects the cities is the edge, and we have the cost of travel.
This kind of graph is called a weighted graph. The cost of an edge is also called weight. See the graph below:
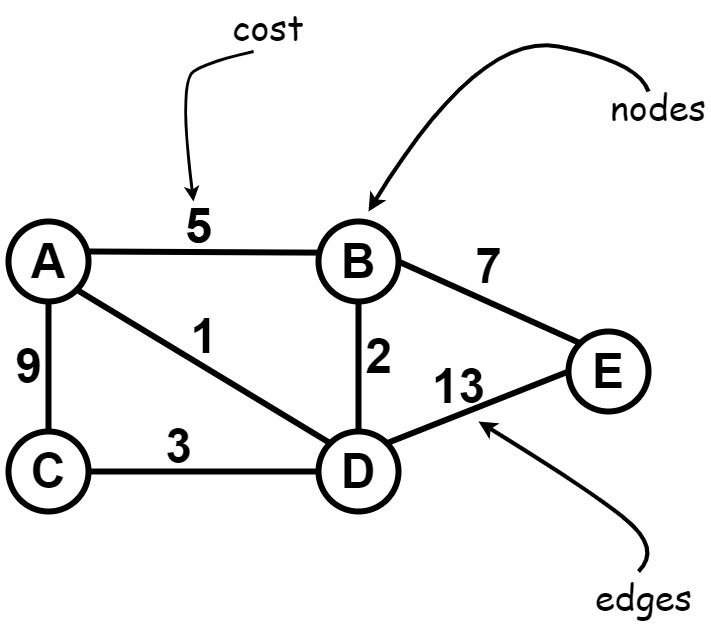
Here the set of edges, E = {(A, B, 5), (A, C, 9), (B, D, 2), (B, E, 7), (C, D, 3), (D, A, 1), (D, E, 13)}. (A, B, 5) means A and B are neighbors and the weight/cost of the edge is 5.
A graph without the costs actually represents a constant cost. That means the cost of all edges in the graph is the same. It is called an unweighted graph. Usually, we don’t need to specify the constant cost when programming an unweighted graph.
From the above discussion, we have seen four basic types of graphs:
- Undirected graph
- Directed graph
- Unweighted graph
- Weighted graph
Now let’s see how to program a graph in Python.
Two Types of Graph Representation
Two commonly used methods to represent a graph in a program are:
Adjacency Matrix Representation
In this method, we represent a graph as a square matrix. If there is a path between two nodes, the value of their corresponding cell is 1, otherwise, the value is 0.
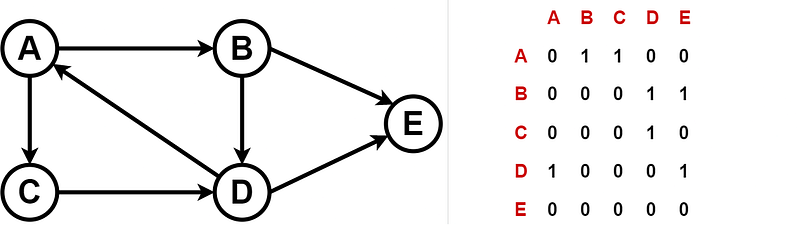
In the case of weighted graphs, instead of 1, we put the cost of the edge in the corresponding cell.
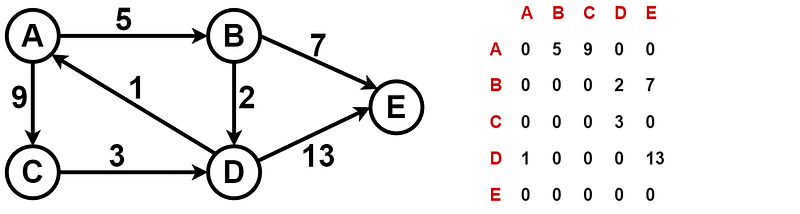
In Python, we can represent graphs like this using a two-dimensional array. And a two-dimensional array can be achieved in Python by creating a list of lists.
The indices of the list will represent the nodes. So if we want to create a graph having 5 nodes, we will represent the nodes from 0 to 4.
So, we need to convert the above graph like this:
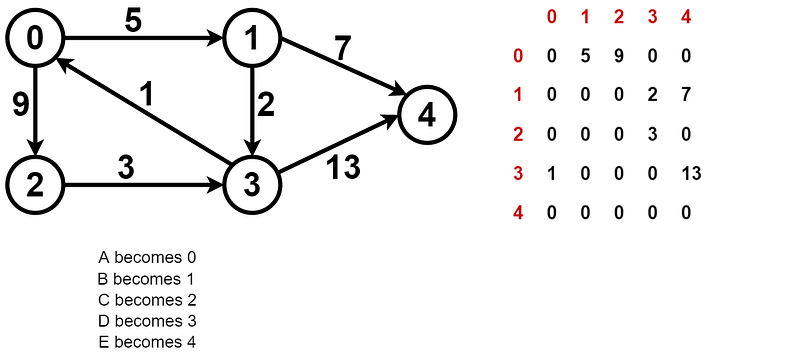
Let’s create this graph in Python:
If graph[i][j] == 0, then there is no path between node i and j. But if graph[i][j] gives us a value other than 0, we can say there is a path between node i and j.
For graph[0][1], the output is 5. That means there is a path between node 0 and node 1 and the path cost is 5. This represents edge(A, B) in our graph.
Similarly, graph[3][4] gives output 13. That means there is a path between node 3 and node 4 and the cost is 13. In our graph that represents edge(D, E).
We don’t want to hardcode the graph like this. We want to take the edges as input and then construct the graph from that. The input will be two neighbor nodes along with the path cost.
I will get into all these details when discussing adjacency list representation. Because when solving graph problems, adjacency list is the preferred method over adjacency matrix most of the time.
Adjacency List Representation
Now we will see the adjacency list representation of a graph. We will also learn how to construct the graph by taking input rather than hardcoding the graph. We will finally create a reusable Graph class to create and represent a graph.
Adjacency list of a directed graph:
See the following directed graph and its adjacency list representation:
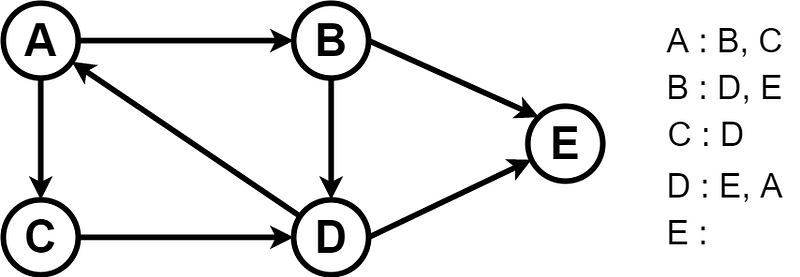
In this method, we associate all the neighbor nodes of a node together. From node A we can go to nodes B and C. So, we create a list of all the neighbor nodes of A, which becomes A: [B, C].
In Python, we can use a dictionary to represent a graph like this. The keys of the dictionary will be a particular node, and the value of each key will be a list of its neighbor nodes.
See the following code:
Output:
A-->[‘B’, ‘C’]
B-->[‘D’, ‘E’]
C-->[‘D’]
D-->[‘E’, ‘A’]
E-->[]
The dictionary graph represents the graph described above.
Now let’s see how to construct this structure of the graph from user input. We can create a function addEdge(). This function will receive two parameters, the two nodes having a path between them. So, addEdge(‘A’, ‘B’) will mean node A and node B are neighbors.
But there is a problem. We have to call the addEdge() function every time we went to create an edge of the graph. It would be nice if we could input the whole graph and the adjacency list be created at once.
We need to input the number of nodes and edges of the graph. And then we will input each pair of nodes having a path between them. So, in the console the input for the above graph will be:
5 7
A B
A C
B D
B E
C D
D A
D E
We need to tweak the code a little bit:
Output:
A-->[‘B’, ‘C’]
B-->[‘D’, ‘E’]
C-->[‘D’]
D-->[‘E’, ‘A’]
E-->[]
Here the neighbor nodes are taken input using a loop, and in each iteration, the edge is added to the graph.
Adjacency list of an undirected graph:
In an undirected graph, edge(A, B) means there is a path from A to B and also there is a path from B to A.
Consider the following undirected graph and its adjacency list representation:
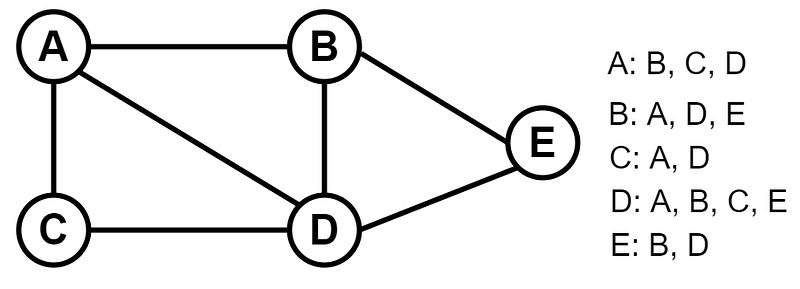
For input: A B, we need to do graph[‘A’].append(B) as well as graph[‘B’].append(A). So we need to do the append operation for each node of one input.
For an undirected graph the addEdge() function is:
Adjacency list of a graph with path costs:
For a weighted graph, we need to input the cost of each edge as well.
See the adjacency list of the weighted graph below:
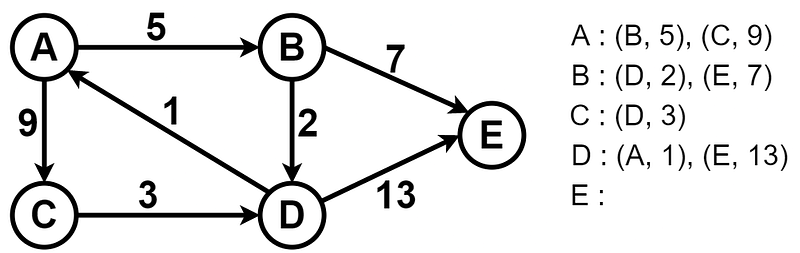
To create this graph, in each input we will take two neighbor nodes along with their path cost:
5 7
A B 5
A C 9
B D 2
B E 7
C D 3
D A 1
D E 13
And in each append() operation we will take the neighbor node and path cost as a tuple. Here is the code for a weighted graph:
Output for the above input:
A-->[('B', 5), ('C', 9)]
B-->[('D', 2), ('E', 7)]
C-->[('D', 3)]
D-->[('A', 1), ('E', 13)]
E-->[]
The Graph Class
Now it's time to wrap up everything and create a class to construct and represent a graph. Here is the final Graph class:
The Graph class has two methods. addEdge() method constructs the graph from input, and printGraph() method represents the graph in a nice format.
Take Input From File
When working with graphs it is good practice to create an input file and read the input from this file. This way we don’t have to input the entire graph every time we run the code. Debugging becomes much easier this way.
So, we will create a file input.txt. Input the graph one time in this file. Then read the input from this file.
input.txt to input the graph:
main.py when reading from the file:
Conclusion
In this article, I explained how to construct and represent a graph in Python. We created a Graph class that can be used further to solve graph-related problems:
I hope you find this helpful. Thanks for reading.
Helpful Resources
If you enjoy reading articles like these, consider becoming a Medium member. That gives you unlimited access to all stories on Medium. If you sign up using my referral link below, I’ll earn a small commission from your $5 monthly fees. This way you can support me as a writer.


