
How to Reduce Your Forecasting Error by 35%
This article presents a clear step-by-step approach to reducing your forecasting by up to 35%: collect and clean your data, use machine learning, and enrich your forecasts using the forecast value added framework.
Poor forecasts result in excess inventory, obsolete products, inappropriate long-term capacity planning, supplier tensions, shortages, and emergency expeditions. In short, they harm profitability, frustrate your teams, and waste resources. On the other hand, accurate forecasts will allow you to produce more effectively the required products, ship them on time where they are needed, improve long-term supply planning, and increase your service levels while reducing your inventory levels.
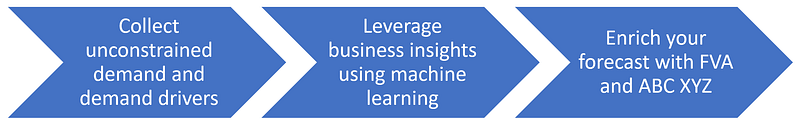
Thanks to our experience creating models, training, and coaching professionals, we could boil down our technique to improve forecasting accuracy into three main steps, as highlighted in the figure below.
Step 1: Data Collection
This first step focuses on data collection and cleaning. It is often overlooked as it is not the sexiest, but it is the required foundation for your forecast-improvement project. Without proper execution of this crucial step, there is no hope that you can succeed with your overall objective.
Demand Data
The most critical piece of data to collect is historical unconstrained demand. Unfortunately, most supply chains are tracking constrained sales instead. (See this article for more information about the difference between the two.) The easiest way to unconstraint your sales is to track historical inventory levels and censor periods with shortages in your forecasting engine. (Some statistical models can do that, but, unfortunately, most software vendors do not include this feature.)
Note that to grasp the impact of shortages fully, you should forecast weekly or daily demand.
Demand Drivers
You need to assess the main business drivers impacting your demand. I call these demand drivers. The most common are:
- Promotion
- Pricing
- Weather
- Number of stores and opening hours
Many business leaders also consider using macroeconomic indicators to enrich their forecasts. I wouldn’t advise including these: it is especially difficult to link an overall macroeconomic KPI to the sale of a specific product during a specific week in a specific store. Moreover, you won’t be able to predict future values of these indicators: so you could use them to explain historical sales but not to predict future ones.
Now that we have accurate historical demand data and demand drivers, we can move on to create our forecasting model.
Step 2: Model Creation
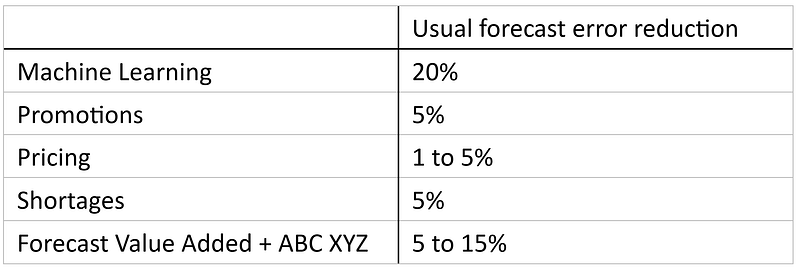
Usually, proper machine learning models can provide a 20% forecast error reduction compared to statistical benchmarks. (As explained in this article, I advise using moving averages as forecasting benchmarks). On the other hand, classical statistical models often only show minimal added value (except if your dataset displays a strong, predictable seasonality).
Machine learning models usually get another 1 to 5% accuracy boost for each demand driver you feed to the model. This means that adding prices, shortages, and promotions to your model should result in an overall 30 to 35% improvement.
More and more software vendors include machine learning models in their forecasting packages. But, these by-default basic models are simply not up to the challenge. Only custom-made models will allow you to reap the benefits mentioned in this article.
Step 3: Enrich your forecast using FVA and smart ABCXYZ
By properly managing your demand planning team and the various stakeholders (sales, marketing), you can easily reduce the overall forecast error by another 5 to 15%.
Here is how:
- Train your team on identifying intentional and unintentional judgmental biases. Otherwise, judgmental biases will cripple your accuracy (and overall bias) while frustrating team members.
- Implement Forecast Value Added. This is the cornerstone of demand planning excellence.
- Multiply your planners’ efficiency by using smart ABC-XYZ segmentation. Pay attention not to segment your products using inappropriate segmentation criteria, such as demand variability and historical volumes or profits. (More about this in my book, Demand Forecasting Best Practices.)
Of course, as your models get more robust and leverage more insights, enriching your forecasts will become more and more difficult.
Recap
We highlighted a 3-step process to drastically improve your forecasting accuracy:
- Data collection. Collect unconstrained demand data and demand drivers.
- Model creation. Use machine learning to leverage business insights and data from step 1.
- Enrichment process. Track forecast value added and use ABC XYZ to focus your work.
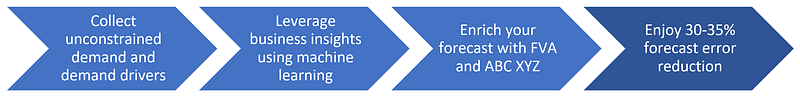
The expected forecasting error reduction should be as highlighted below:
What’s the expected business value of such a forecasting error reduction?
Our latest research is pointing at a 10–14% inventory reduction or a 15–20% shortage reduction.


