
How to produce Interactive Matplotlib Plots in Jupyter Environment
Create Interactive Plots/maps with All Python libraries that use Matplotlib

Matplotlib is extremely powerful visualization library and is the default backend for many other python libraries including Pandas, Geopandas and Seaborn, to name just a few.
Today, there are different options to enable interactivity with Matplotlib plots. However, the new native Matplotlib/Jupyter Interactive widgets offer more extensive usage and benefits to all third party packages that use Matplotlib.
Built on top of Matplotlib and Widgets, this technique allows you to have interactive plots without third party libraries. The only requirement is to install Ipympl and all interactivity extensions are readily available in your Jupiter notebook environment.
In this tutorial, I will cover some use cases and examples of interactive data visualization with Matplotlib using ipympl. We will first cover the basics of ipympl, its canvas and figures with some examples.
Leveraging the Jupyter interactive widgets framework, IPYMPL enables the interactive features of matplotlib in the Jupyter notebook and in JupyterLab.
IPYMPL in Jupyter Lab
To enable interactive visualization backend, you only need to use the Jupyter magic command:
%matplotlib widgetNow, let us visualize a matplotlib plot. We first read the data with Pandas and create a scatter plot with Matplotlib.
url =df = pd.read_csv(
“https://raw.githubusercontent.com/plotly/datasets/master/tips.csv”
)# Matplotlib Scatter Plot
plt.scatter(‘total_bill’, ‘tip’,data=df)
plt.xlabel(‘Total Bill’)
plt.ylabel(‘Tip’)
plt.show()And with no additional code and only using the simple matplotlib code, the output is an interactive plot where you can zoom in/out, pan it and reset to the original view. Below GIF image displays the interactivity possible with ipympl.
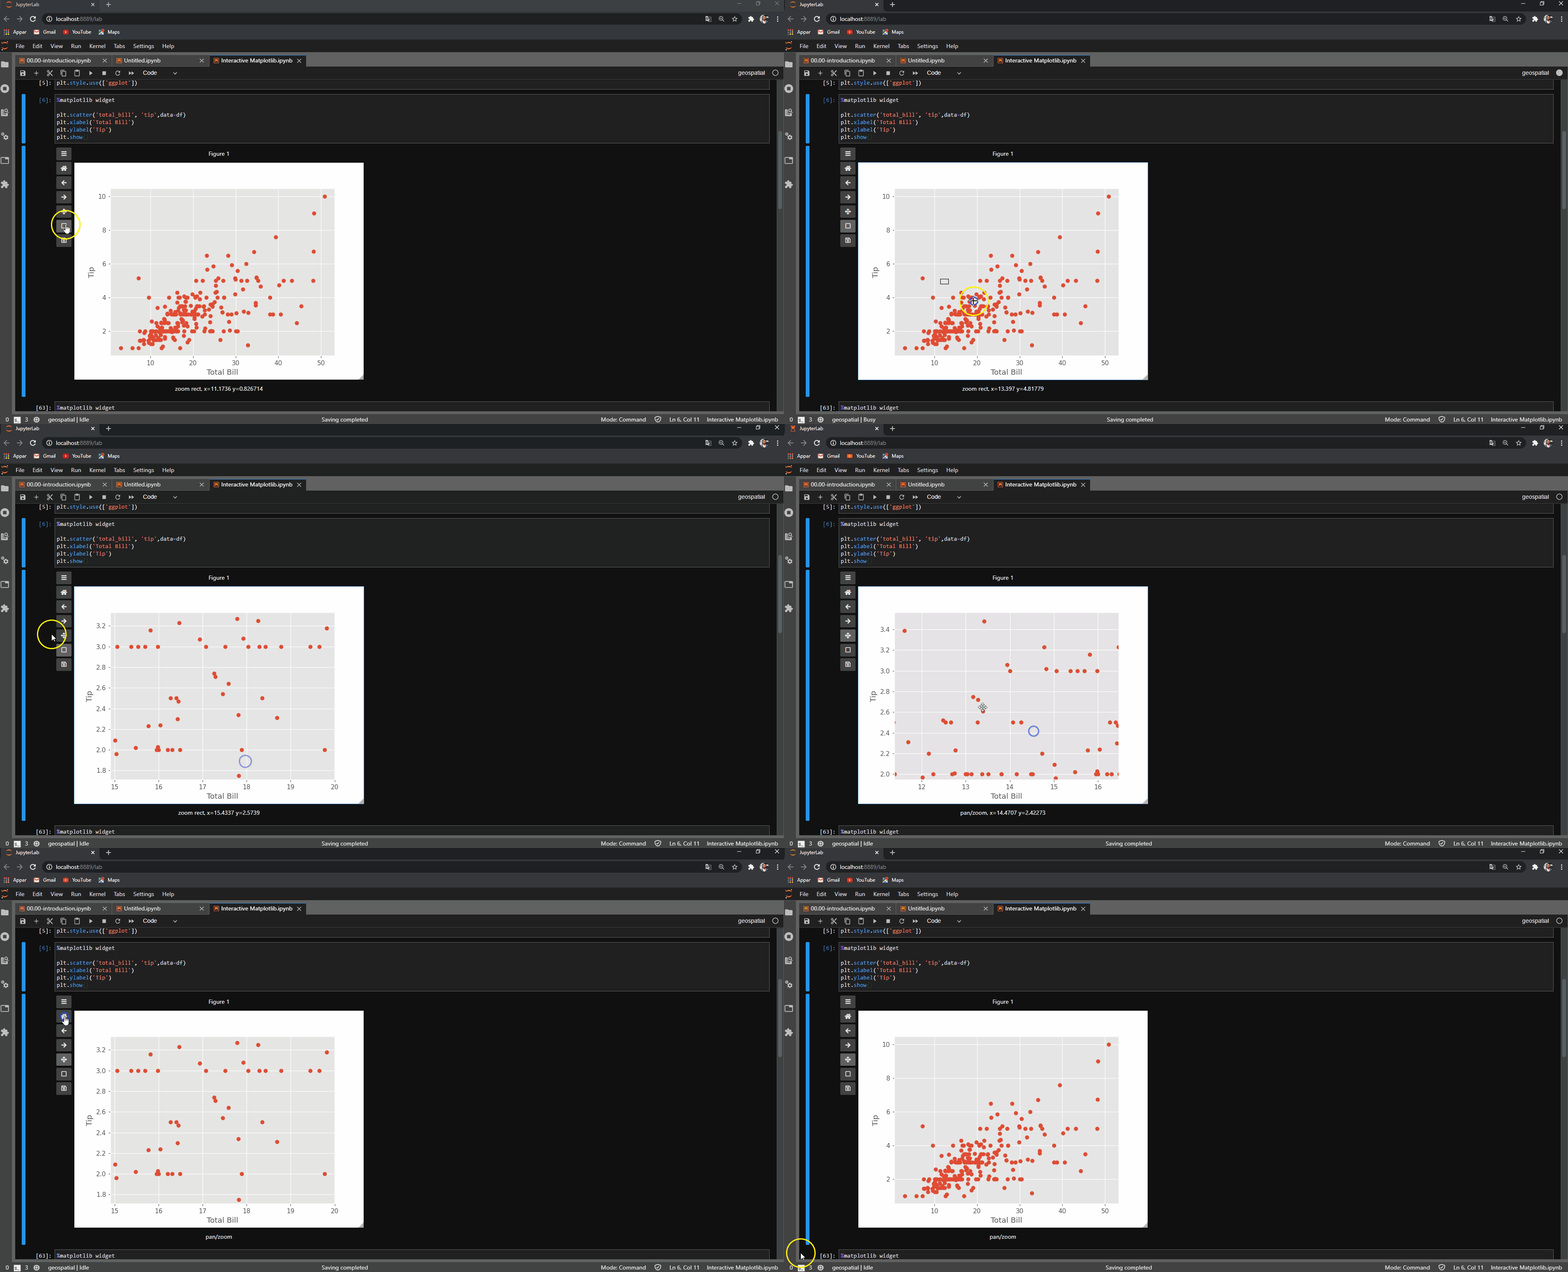
Besides, you can also customize the User Interface’s visibility, the canvas footer, and canvas size.
fig.canvas.toolbar_visible = False
fig.canvas.header_visible = False
fig.canvas.resizable = True
These commands alter the User Interface of Ipympl and Matplotlib plots. The buttons will disappear from the UI but you still have the functionality. To revert back to the usual matplotlib plots, you can call the matplotlib inline:
%matplotlib inlineLet us move to Interactive plots with Pandas.
Interactive Pandas plots
Pandas plots are built on top of Matplotlib; therefore, we can also create interactive pandas plots with Ipympl. Let us take a simple Line plot with Pandas.
df.plot(kind=”line”)Lo and behold, we have an interactive plot with Pandas. This line plot is dense, and with this interactive functionality, we can zoom in to a particular place and interact with the plot. See the below GIF.

Note that Pandas has already some interactive backend options including Plotly and Bokeh. However, this does not extend to other libraries built on top of Pandas. One such library is Geopandas, which gets its first interactive maps thanks to Ipympl.
Interactive maps with Geopandas
If you have uses Geospatial data in Pandas, you already know Geopandas, which is widely used in the Geospatial data science landscape. Interactive maps with Geopandas is game-changing. Although pandas had other backend options to make its plots interactive, that was not possible with Geopandas.
As Geopandas is also built on top of Maptlotlib, the interactive backend of Ipympl extends to it as well. We can now have interactive maps within Geopandas without using any other third party geo-visualization libraries.
Let us see an example of an interactive map with Geopandas powered by Ipympl. I will first read the data with Pandas since we are using CSV file and convert it to Geopandas Geodataframe.
carshare = “https://raw.githubusercontent.com/plotly/datasets/master/carshare.csv"
df_carshare = pd.read_csv(carshare)
gdf = gpd.GeoDataFrame(df_carshare, geometry=gpd.points_from_xy(df_carshare.centroid_lon, df_carshare.centroid_lat), crs=”EPSG:4326")We can now plot any geospatial data with Geopandas. We can simply call .plot() to visualize a map. However, in this example, I am also adding a base map for contextual purpose.
import contextily as ctx
fig, ax = plt.subplots()
gdf.to_crs(epsg=3857).plot(ax=ax, color=”red”, edgecolor=”white”)
ctx.add_basemap(ax, url=ctx.providers.CartoDB.Positron)
plt.title(“Car Share”, fontsize=30, fontname=”Palatino Linotype”, color=”grey”)
ax.axis(“off”)
plt.show()
And we have an interactive map with Geopandas. We can zoom in and out and pan the map. That is wonderful.

I use Geoapndas daily, so this is a huge addition without a lot of hurdles. You can still work with Geopandas and have interactive maps without using other third-party packages.
Conclusion
In this tutorial, we have introduced an easy and convenient way to enable interactive plots with Maptlotlib using Ipympl. We have seen how to create interactive plots with Matplotlib, Pandas and Geopandas.
To use Ipympl’s interactive functionality, you can install it with Conda/ pip:
conda install -c conda-forge ipympl
pip install ipympl
If you are using Jupyter Lab, you also need to install node js and jupyterLab extension manager.
conda install -c conda-forge nodejsjupyter labextension install @jupyter-widgets/jupyterlab-manager
jupyter lab build


