
How to Plot a Route on a Map
A tutorial with code examples in python.
For some projects it can be useful to draw routes on a map. Here you can find all the information you need: packages, API’s and code examples. In the end, you can create beautiful interactive maps.
Installation and preliminary work
We are going to use geopy and folium, both packages are designed for working with geospatial data in python. First, install the packages using conda or pip:
# conda
conda install -c conda-forge folium
conda install -c conda-forge geopy
# pip
pip install folium
pip install geopyBesides these packages, you need to be able to call an API that gives route coordinates in multiline segments. An API that does this is the route and direction API. You can make an account on RapidAPI and subscribe to the route and direction API. The RapidAPI free plan consists of 30 000 free calls every month, a nice amount to start with. There are other (more commercial) options available like ArcGIS or Google Maps directions, so choose what fits your case.
Retrieve the route data between two points
The code at the end of this section uses the route and direction API I mentioned earlier. It’s really easy to get the directions between two points: you need to specify the latitude and longitude of the two points. If your dataset contains addresses without latitude and longitude values, don’t worry, it’s easy to convert them. This process is called geocoding. With geopy, it works as follows:
from geopy.geocoders import Nominatimdef get_lat_long_from_address(address):
locator = Nominatim(user_agent='myGeocoder')
location = locator.geocode(address)
return location.latitude, location.longitude# example
address = 'Zeeweg 94, 2051 EC Overveen'
get_lat_long_from_address(address)
>>> (52.4013046, 4.5425025)In the route and direction API, you can also specify the transportation mode you want to use: drive, truck, bicycle, walk or transit.
To call the API, you need an API key. After subscribing you can find it here:

Call the API to get the directions from the first address to the second one:
import requestsdef get_directions_response(lat1, long1, lat2, long2, mode='drive'):
url = "https://route-and-directions.p.rapidapi.com/v1/routing"
key = "YOUR-API-KEY"
host = "route-and-directions.p.rapidapi.com"
headers = {"X-RapidAPI-Key": key, "X-RapidAPI-Host": host}
querystring = {"waypoints":f"{str(lat1)},{str(long1)}|{str(lat2)},{str(long2)}","mode":mode}
response = requests.request("GET", url, headers=headers, params=querystring)
return responseresponse = get_directions_response(52.4013, 4.5425, 52.402, 4.5426)The response variable looks like this (click to enlarge):
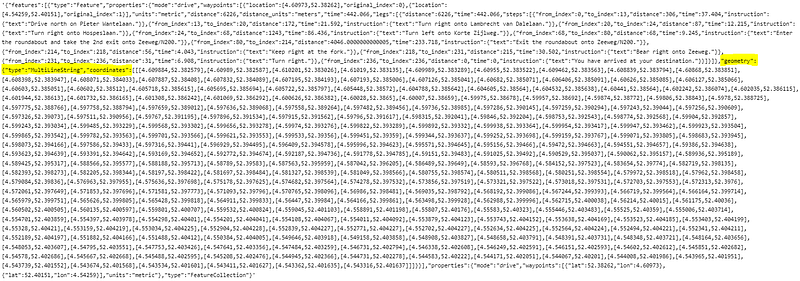
For our route plot, we need the geometry: it contains all the coordinates between which we have to draw lines, this will create the route on the map.
Note that the response also contains driver instructions, like: ‘Enter the roundabout and take the 2nd exit onto Zeeweg/N200.’ Cool, isn’t it? You can use them for navigation purposes.
Now we can use the data to visualize the route!
Creating route plots with Folium
The function below creates a map with a route between two points. The input is the response we received from the API call to the route and directions API. We extract the coordinates from the response. Than we add markers (for the start and end point) and draw the lines using PolyLine . An important part of the script creates the optimal zoom, this ensures that your route will always be in the center of the map. For this we use the minimum and maximum latitude and longitude values and fit_bounds.
import foliumdef create_map(response):
# use the response
mls = response.json()['features'][0]['geometry']['coordinates']
points = [(i[1], i[0]) for i in mls[0]] m = folium.Map() # add marker for the start and ending points
for point in [points[0], points[-1]]:
folium.Marker(point).add_to(m) # add the lines
folium.PolyLine(points, weight=5, opacity=1).add_to(m) # create optimal zoom
df = pd.DataFrame(mls[0]).rename(columns={0:'Lon', 1:'Lat'})[['Lat', 'Lon']]
sw = df[['Lat', 'Lon']].min().values.tolist()
ne = df[['Lat', 'Lon']].max().values.tolist()
m.fit_bounds([sw, ne])
return mm = create_map(response)If you’re working in a Notebook, you can call m and you see:
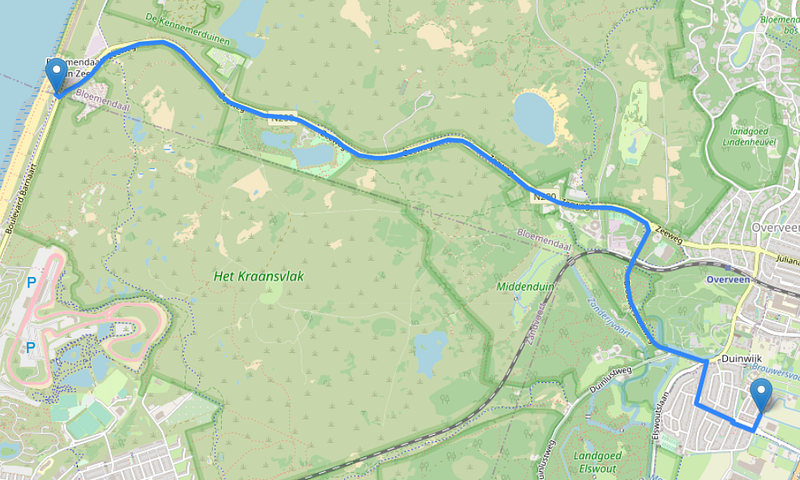
Beautiful! Another option is to save the image as html and open it in a browser:
m.save('./route_map.html')Adding addresses
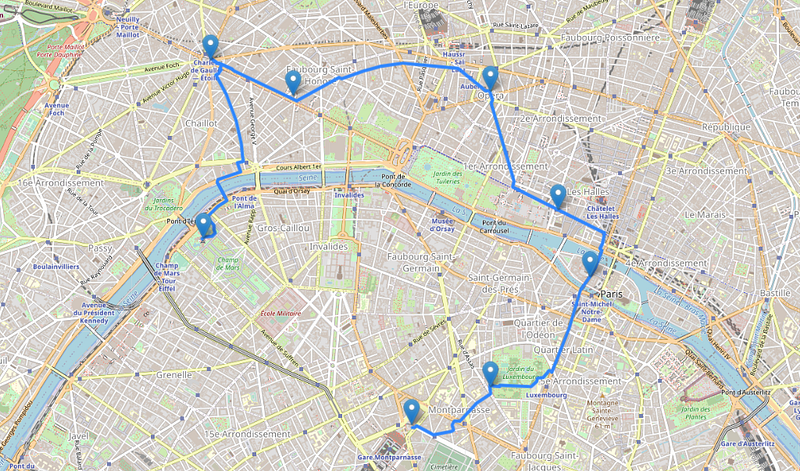
An improvement of the function could be to add more addresses. Let’s create a city walk along the highlights of Paris.
First we specify our addresses:
# touristic route through Paris (Eiffel Tower, Arc de Triomphe, ...)
address1 = '5 Avenue Anatole France, 75007 Paris, France'
address2 = 'Place Charles de Gaulle, 75008 Paris, France'
address3 = '60 Avenue des Champs-Élysées, 75008 Paris, France'
address4 = "Place de l'Opéra, 75009 Paris, France"
address5 = 'Rue de Rivoli, 75001 Paris, France'
address6 = '10 Bd du Palais, 75001 Paris, France'
address7 = '3 Rue Guynemer, 75006 Paris, France'
address8 = '33 Avenue du Maine, 75015 Paris, France' addresses = [address1, address2, address3, address4, address5, address6, address7, address8]Instead of addresses we need coordinates, so we create a list with latitudes and longitudes using the get_lat_long_from_address function we created earlier:
lat_lons = [get_lat_long_from_address(addr) for addr in addresses]Then, we call the API to get the directions between the points with the get_directions_response function:
responses = []for n in range(len(lat_lons)-1):
lat1, lon1, lat2, lon2 = lat_lons[n][0], lat_lons[n][1], lat_lons[n+1][0], lat_lons[n+1][1]
response = get_directions_response(lat1, lon1, lat2, lon2, mode='walk')
responses.append(response)Now we change the create_mapfunction to handle multiple responses:
def create_map(responses, lat_lons):
m = folium.Map()
df = pd.DataFrame() # add markers for the places we visit
for point in lat_lons:
folium.Marker(point).add_to(m) # loop over the responses and plot the lines of the route
for response in responses:
mls = response.json()['features'][0]['geometry']['coordinates']
points = [(i[1], i[0]) for i in mls[0]]
   # add the lines
folium.PolyLine(points, weight=5, opacity=1).add_to(m) temp = pd.DataFrame(mls[0]).rename(columns={0:'Lon', 1:'Lat'})[['Lat', 'Lon']]
df = pd.concat([df, temp]) # create optimal zoom
sw = df[['Lat', 'Lon']].min().values.tolist()
sw = [sw[0]-0.0005, sw[1]-0.0005]
ne = df[['Lat', 'Lon']].max().values.tolist()
ne = [ne[0]+0.0005, ne[1]+0.0005]
m.fit_bounds([sw, ne])
return mm = create_map(responses, lat_lons)m looks like this:
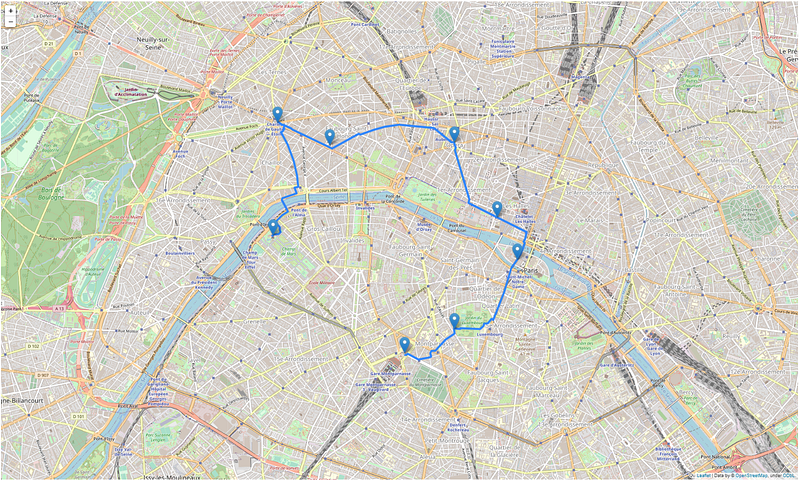
A fun addition here would be to calculate the shortest or fastest route between all the addresses with optimization. More info in the article below (example 2):
Conclusion
In this post, you learned to create routes on interactive maps using folium, geopy and the route and directions API. You can use the maps in many different ways, like in a flask application or combined with plotly to make cool interactions. You can also decide to save the map as a html file with the code m.save('./route_map.html') . This makes it possible to embed the file: <iframe src="route_map.html" height=”500" width="500"></iframe>
Thanks for reading!
Don’t forget to subscribe if you’d like to get an email whenever I publish a new article.


