How to pick uncorrelated stocks for an investment portfolio in Python
A simple Python code to pick the lowest correlated stocks from S&P 500

Portfolio investing is a fascinating kind of investment that can potentially lead to satisfactory returns. According to Modern Portfolio Theory, it’s always a good idea to select stocks or ETFs that show a low correlation.
Let’s see why and how to select stocks measuring their correlation in Python.
Note from Towards Data Science’s editors: While we allow independent authors to publish articles in accordance with our rules and guidelines, we do not endorse each author’s contribution. You should not rely on an author’s works without seeking professional advice. See our Reader Terms for details.
What is linear correlation?
Correlation between stocks is a measure of how the returns of a stock interfere with the returns of another one. If two stocks are highly correlated, they will likely move in the same direction (i.e. if a stock price rises, the other stock price rises too) or in the opposite direction.
Mathematically speaking, the linear correlation index between two stocks, say a and b, is defined as:

where the numerator is the covariance between the stocks and denominator is the product of the standard deviations.
This number spans from -1 to 1. If it’s -1, the stocks move in the opposite directions (i.e. if one stock rises, the other stock goes down), if it’s equal to 1, the stock move perfectly in the same direction. If it’s equal to 0, the stocks are uncorrelated and their movements are independent of each other. We must look for these uncorrelated stocks.
Why should we select uncorrelated stocks?
If we build a portfolio made by some stocks and their weights are x, the variance of the portfolio is:

So, as long as the correlation between stocks is positive, the variance of our portfolio increases with respect to the sum of the variances and so does its risk. Some may argue that we would like stocks that are negatively correlated, but in this case, there wouldn’t be any return, because if a stock rises, the other stock falls and the net return is 0.
So, the idea is to keep our stocks uncorrelated in order to remove the second term and avoid a higher variance. That is the purpose of a branch of Modern Portfolio Theory and there are mathematical tools that allow us to optimize variance according to the weights x. For this article, we are going to focus on selecting those stocks that show an absolute value of the linear correlation nearly equal to 0.
The code
In this part of the article, we are going to work with S&P 500 stocks and we are going to find the couples of stocks that are less correlated to each other. Everything can be found in my GitHub repository: https://github.com/gianlucamalato/machinelearning/blob/master/Stocks_correlation.ipynb
We’re going to use pandas library to perform all the calculations, while the list of S&P constituents will be downloaded from this GitHub repository: https://github.com/datasets/s-and-p-500-companies/tree/master/data
First of all, let’s import some useful libraries:
Then we want to get all the S&P 500 stocks in a historical time range, for example from 2018 to 2019. Let’s first download S&P 500 historical data in order to get the effective trading days in this period.
Now we can scroll the tickers data frame and download the historical data for each symbol. Since some stocks in our list may have been delisted or may be too new, we check if each stock has been traded in the trading days of the S&P 500. If not, we discard the stock. This happens if the stock is not part of S&P 500 anymore or if it’s too new according to our historical time range. Since we want to have a homogeneous time interval, we discard such stocks.
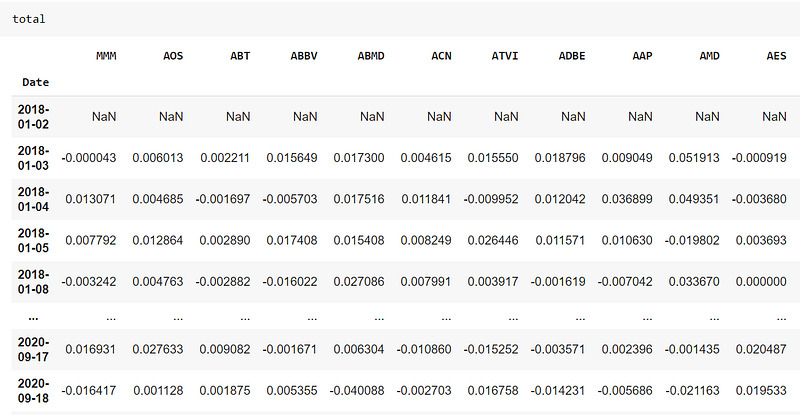
Then, for each stock, we calculate the daily percentage return.
This is the total data frame. Each column is the daily return of a stock whose name is the name of the column. The index is the date.
We can now calculate the linear correlation between each stock using the Pandas’ “corr” method, then we can normalize this table using the “melt” method to transpose the columns into rows.
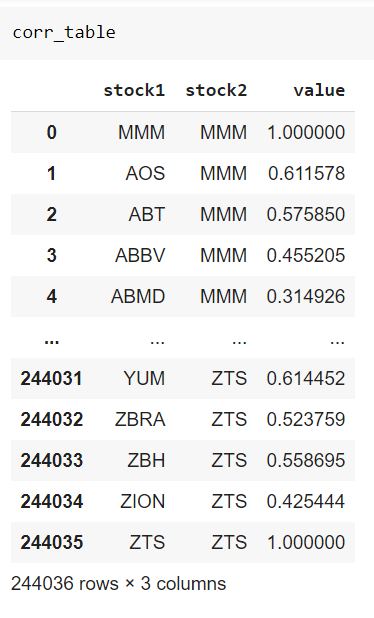
As you can see, we have the correlation of each stock with itself (which is obviously 1) and we get the correlation of stock A with stock B and of B with A, which is the same since correlation is symmetrical. We can remove these useless records and calculate the absolute value of the correlation index.
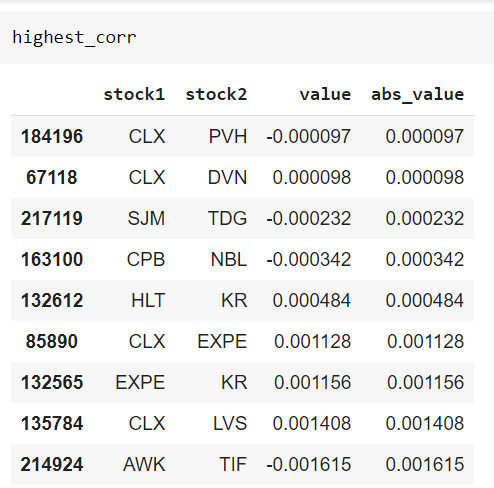
Then we can sort our table by the absolute value ascending, so we have the less correlated pairs of stocks in the first records.
And, finally, this is the table of the less correlated pairs of stocks of S&P 500 in the 2018–2019 period.
Conclusions
Calculating the correlation between stocks is useful and must be done by every portfolio investor. However, the correlation may change during time, so it may be useful to calculate it periodically in order to adjust an investment portfolio and to make it not suffer from sudden correlations that may increase the overall risk.


