
How to perform the chi squared test in both R and Python

A chi squared statistic is a test that measures how a model compares to actual observed data. The data used in calculating a chi squared statistic must be random, raw, mutually exclusive, drawn from independent variables and drawn from a large enough sample.
Chi squared tests are often used to test hypotheses. The chi squared statistic compares the size of any discrepancies between expected results and actual results, given the size of the sample and number of variables in the relationship.
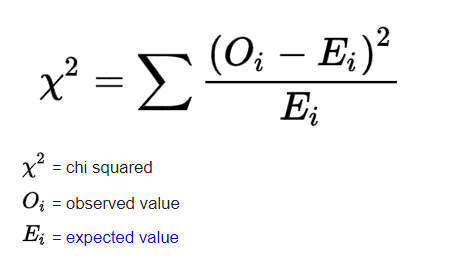
The formula for the chi squared test is found below:-
In this post I intend to cover three statistical questions where the chi squared test is used and solve the problem in both R and Python. I have obtained the code in R and then translated that code into Python, since Python is such a popular programming language.
R is a statistical programming language that has been written for statisticians. I have written the code in R using Replit, which is a free online interpreter that hosts a variety of programming languages.
Python is an all purpose programming language that relies on the use of the scipy or statsmodels library to carry out statistical computations. I have written the code in Python using Google Colab, which is a free online Jupyter Notebook hosted by Google.
Dice

The first question is about dice. The problem statement reads:-
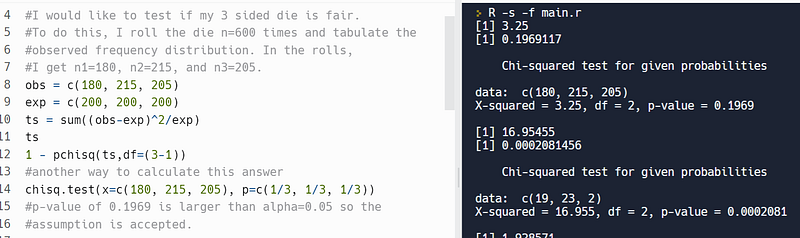
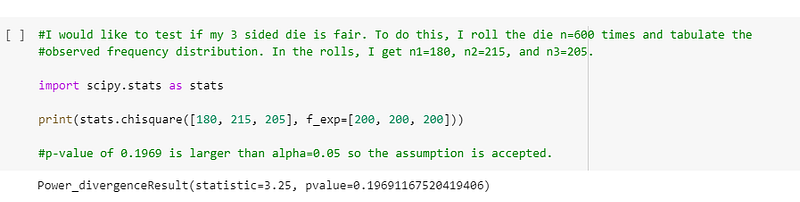
I would like to test if my 3 sided die is fair. To do this, I roll the die n=600 times and tabulate the observed frequency distribution. In the rolls, I get n1=180, n2=215, and n3=205.
I used R’s chisq.test function to solve the problem. The p-value for this test is 0.1969, which is higher than alpha=0.05, so the assumption is accepted:-
I translated the code to Python using scipy’s chisquare function and obtained the same p-value:-
Cars

The second question concerns cars. The problem statement reads as:-
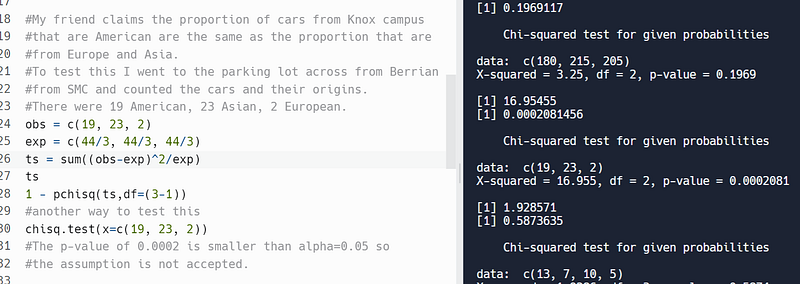
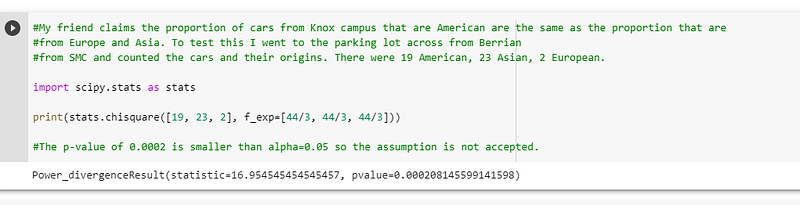
My friend claims the proportion of cars from Knox campus that are American are the same as the proportion that are from Europe and Asia. To test this, I went to the parking lot across from Berrian from SMC and counted the cars and their origins. There were 19 American, 23 Asian, and 2 European.
I used R’s chisq.test function to solve this problem. The p-value for this question is 0.0002, which is less than alpha=0.05, so the assumption is not accepted:-
I translated the code using scipy’s chisquare function, which revealed the same p-value as R:-
Maths

The last question in this post concerns maths. The problem statement reads as:-
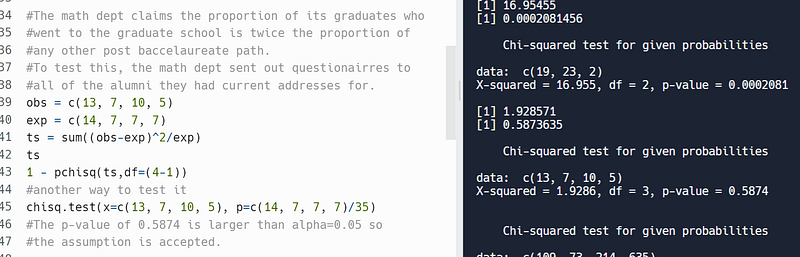
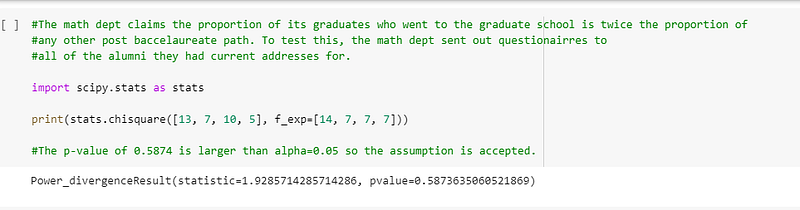
The math dept claims the proportion of its graduates who went to graduate school is twice the proportion of any other post baccalaureate path. To test this, the math dept sent out questionnaires to all of the alumni they had current addresses for.
I solved this problem using R’s chisq.test function. A p-value of 0.5874 was obtained, which is higher than alpha=0.05, so the assumption has been accepted.
I used scipy’s chisquare function to solve this problem and the p-value computed was the same as R’s:-
There was a fourth question that I could have put in this post, but I was unable to translate it efficiently using scipy’s chisquare test.
The reason for this is because R allows for the insertion of percentages in the p argument and I have been unable to replicate this in Python. I have included the fourth question in my code review if any reader is interested in looking at it.
Because R allows for the use of percentages and rescaling in its chisq.test function, I feel the language has outperformed Python in this instance.
I have prepared a code review to accompany this blog post, which can be viewed here:- https://www.youtube.com/watch?v=8fCiUYIRseE