
How To Monitor a Spring Boot App With Prometheus and Grafana
A step-by-step guide on how to set up monitoring for a Spring Boot app

Monitoring microservices is a challenging task. It’s a crucial step toward having a stable production system. By observing various metrics, we understand how the system behaves under different load conditions and which metrics need more attention.
In this tutorial, I’ll show you how to set up Prometheus and Grafana to monitor a Spring Boot application.
You’ll learn how to:
- Configure Spring Boot Actuator to enable metrics
- Configure Prometheus to scrape the metrics
- Use PromQL to query various metrics in the Prometheus UI
- Visualize the metrics in a Grafana Dashboard
This article assumes you have basic Spring Boot knowledge. We’ll concentrate on the monitoring configuration part.
Let’s get started!
Prepare the Project
Understand the components
First, let’s take a look at the diagram below to understand how the monitoring works:
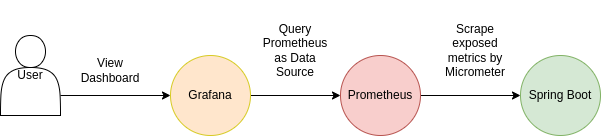
- The Spring Boot app has an Actuator module that allows us to monitor and manage our app. It integrates flawlessly with third-party monitoring tools, such as Prometheus.
- Micrometer collects the metrics from our app and exposes them to external systems, in this case, Prometheus.
- Grafana is a visual tool that shows the metrics from a data source (e.g. Prometheus) in a Dashboard.
Add the dependencies
I’ve prepared a simple Spring Boot project for this demo. You can find the complete source code under the references section.
We need the following dependencies:
<dependency>
   <groupId>org.springframework.boot</groupId>
   <artifactId>spring-boot-starter-web</artifactId>
</dependency><dependency>
<groupId>org.springframework.boot</groupId>
<artifactId>spring-boot-starter-actuator</artifactId>
</dependency><dependency>
<groupId>io.micrometer</groupId>
<artifactId>micrometer-registry-prometheus</artifactId>
<scope>runtime</scope>
</dependency>Configure Spring Boot Actuator
Now let’s configure the application.yml file to enable monitoring:
Note that we enabled the health, metrics, and Prometheus paths.
Start the app and open http://localhost:8080/actuator.
You should see the following endpoints:
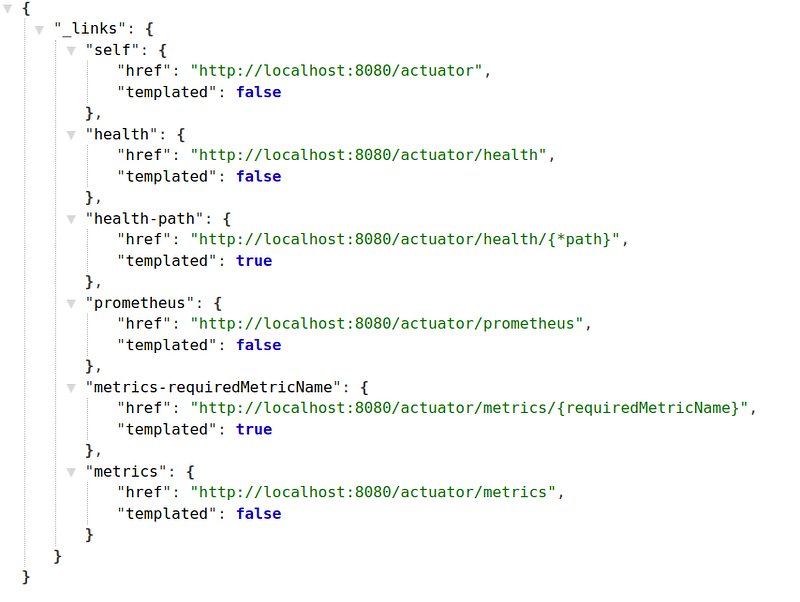
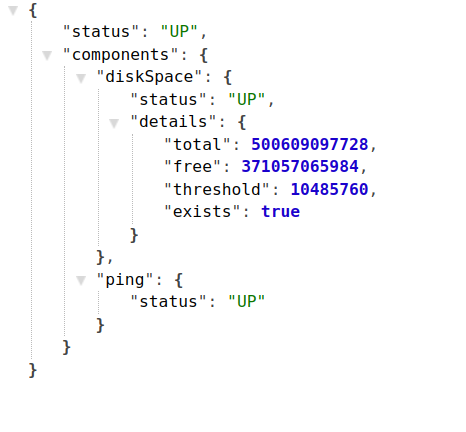
The health endpoint shows if our app is running or not:
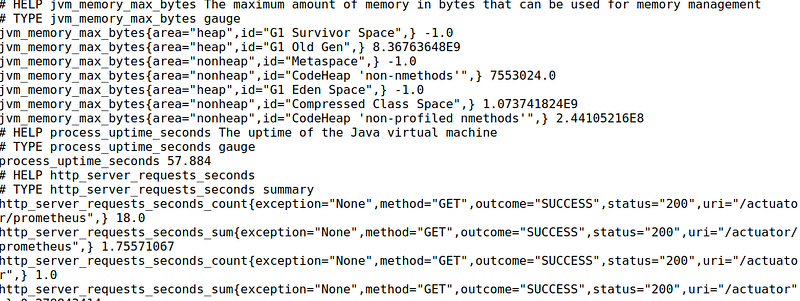
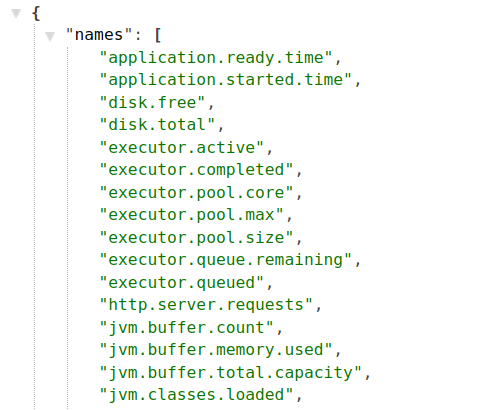
The prometheus endpoint shows various metrics, such as JVM threads state, information about HTTP server requests, etc.
The metrics endpoint gives information about JVM memory, system CPU usage, etc.
Configure Prometheus
Prometheus gathers metrics at intervals and needs to know how often to scrape them. We need to set up a config file for this.
Create a new file prometheus.yaml with the following content:
Important notes:
- It instructs Prometheus to scrape the app every three seconds.
- The target is the host and port of our app.
- The path we want to scrape is the
prometheuspath, which you saw earlier.
Install and Run Prometheus and Grafana in Docker
We’ll create a docker-compose.yml file to install and start Prometheus and Grafana.
The file should look like this:
Make sure the path to the prometheus.yaml file is correct!
Let’s start the services by running this command:
$ docker-compose upPrometheus is accessible via http://localhost:9090/.
Grafana is running on http://localhost:3000/. When it prompts for login details, use the ones from the docker-compose.yml file.
Let’s start the Spring Boot app to collect and view some metrics.
Open http://localhost:8080/actuator/prometheus.
If we want to view the data in Prometheus, we can query it using PromQL, which is the Prometheus query language.
Great! The scraping part works. We can see the metrics in Prometheus.
Although Prometheus has a decent UI, Grafana’s Dashboard is more powerful. So, let’s visualize the metrics in Grafana.
Configure Grafana
First, we need to add Prometheus as a Data source. You need your local IP address and 9090 as the port from Prometheus. Of course, this is used for local testing only. In real life, you would have a Prometheus server running somewhere.
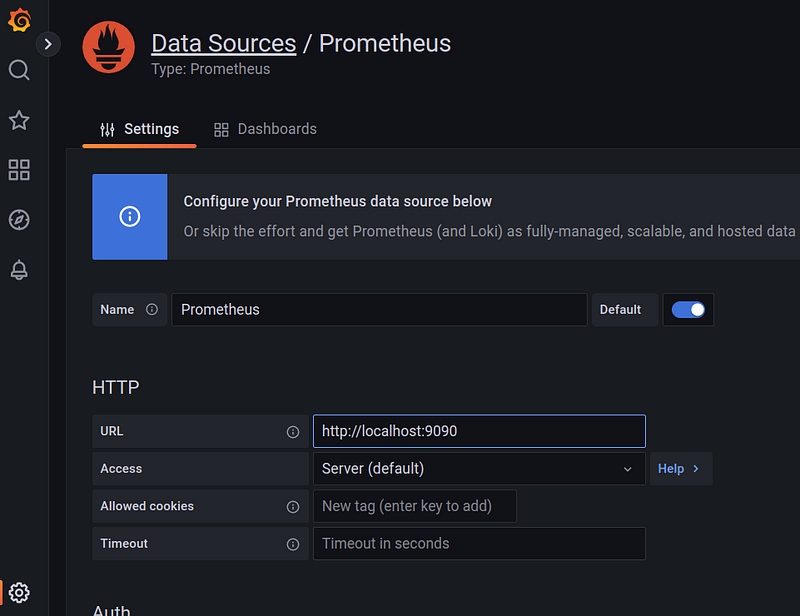
Click Save and Test at the end of the screen. You should see a message that the data source has been connected.
Go to Dashboards -> New Dashboard -> Add panel.
You should see Prometheus as the data source. Now we can query all metrics.
Awesome! It works as expected.
Import a Predefined Dashboard in Grafana
We can also import a ready-to-use dashboard. Grafana offers something like a marketplace where we can choose from numerous templates. Since we have a Spring Boot app, we can take advantage of one of the pre-configured dashboards for spring boot.
Go to Dashboards -> New Dashboard -> Import.
We can either search for the dashboard or just enter the template id into the Import field:
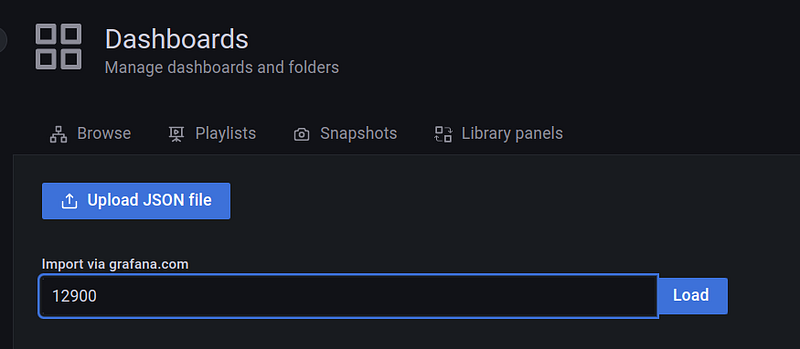
In this example, the id is 12900. Click Load. Choose Prometheus as the data source and click Import.
Great! You now have a complete Spring Boot Dashboard:
That’s it! It was pretty simple to configure the monitoring part.
Conclusion
Now you know how to scrape and visualize various metrics from a Spring Boot app using Actuator, Prometheus, and Grafana.
The setup was elementary, without any customization and authentication. There is still much more that you could do to monitor your app. For example, you can create your custom endpoints and metrics. Only authorized users may access specific information.
I plan to create an advanced tutorial where I’ll show you how to create custom endpoints and add security.
Thank you for reading, and stay tuned for the next part!


