
How To Measure Downside Risk of Stock Investment With Python
Downside risk is the financial risk associated with the loss. Investors are interested to estimate the potential loss in value of their stocks due to the volatility of the market condition from time to time.
In this article, I am going to present a step by step guide using Python to measure the downside risk based on:
a) Drawdown
b) Value at Risk (VaR)
c) Conditional Value at Risk (CVaR)
Disclaimer: The writing of this article is only aimed at demonstrating the steps to perform downside risk measurement on stock data with Python. It doesn’t serve any purpose of promoting any stock or giving any specific investment advice.
Prerequisite Python Libraries
- yFinance — https://pypi.org/project/yfinance/
- Pandas — https://pandas.pydata.org/
- Numpy — https://numpy.org/
- Matplotlib- https://matplotlib.org/
- Scipy — https://www.scipy.org/
Github
The original full source codes presented in this article are available on my Github Repo. Feel free to download it if you wish to use it to follow my article.
Acquisition of Stock Data
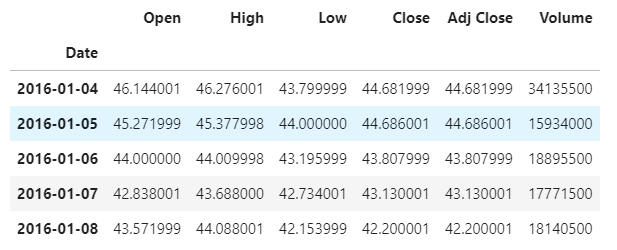
Firstly we are going to use yFinance to obtain the stock data of Tesla. yFinance is an open-source library that enables us to fetch stock data from Yahoo Finance.
Line 1–7: Import all the required libraries.
Line 9–10: Use yFinance download method to fetch the Tesla stock data from 4 Jan 2016 till 25 Jun 2021.
yFinance will return the stock data in dataframe format.
Measuring Drawdown
Now, we can move on to compute the drawdown of the Tesla stock over the past 5 years. Drawdown refers to a peak-to-trough decline during a specific period for an investment or trading account.
Line 1: Compute the daily adjusted close returns by using the pct_change method.
Line 2: Next, calculate the cumulative stock return over time and assign the result to the variable wealth_index.
Line 3: Measure the previous peak by obtaining the cumulative maximum using the cummax method.
Line 4: The drawdown over time can be computed by subtracting the cumulative stock returns from the previous peak and divide the result by the previous peak itself.
Line 5: Plot the drawdown over time.
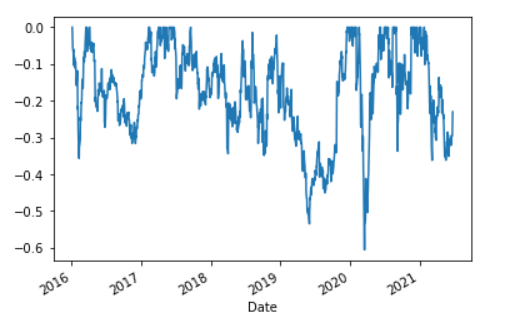
Basically, the drawdown is downside volatility. From the plot above, we can see Tesla experienced a relatively deeper drawdown in the mid of 2020.
Measuring Value at Risk (VaR)
Value at Risk (VaR) refers to a threshold that indicates a loss will not exceed a certain level. VaR is always given a confidence level which is quoted with quantiles such as 95, 99, and 99.9.
Let say we have VaR(85) = -3.5% for a stock, this means the losses of the stock investment will not exceed -3.5% with 95% probability in a given day based on historical values.
Now, we are going to write some simple Python scripts to measure the VaR with 90%, 95%, and 99%, respectively.
Line 1: Use the sort_values method to sort the daily stock returns in ascending order.
Line 3–5: The VaR with 90%, 95% & 99% are computed with the quantile method by giving it a parameter of 0.1, 0.05, and 0.01, respectively.
Line 7: Display the VaR values in a tabulated format.
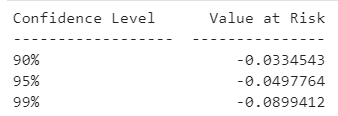
From the result above, we learn that the Tesla stock investment’s loss won’t exceed -8.99% with a 99% certainty based on the historical value over the past five years.
Measuring Conditional Value at Risk (CVaR)
Conditional Value at Risk (CVaR) refers to a measurement of an estimate of expected losses in the worst scenarios. Similar to VaR, CVaR is also always quoted with quantiles such as 90, 95, or 99.
If a CVaR(95) = -3%, this means in the worst 5% of cases, losses were on average exceed -3% based on the historical values.
The Python script below will compute the CVaR for 90%, 95%, and 99% confidence levels.
Line 1–3: Extract only the daily stock returns which are less than VaR(90), VaR(95), and VaR(99), respectively. It is then followed by using the mean method to compute the average of the extracted values.
Line 5: Display the resulting CVaR values in a tabulated format.
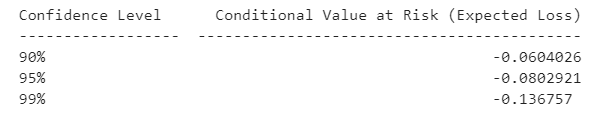
From the result above, we can see the CVaR of Tesla can reach -13.67% at a confidence level of 99% based on the past 5 years of historical data.
Conclusion
Downside risk can be viewed as a way to calculate and quantify the worst-case loss that results from the uncertainty of the stock market. Obviously, investors are worried more about losing their capital (downside risk) than the positive gains they can attain from their investment.
Fortunately, Python enables us to easily compute the downside risk with several lines of scripts. The computed downside risk can then help to estimate the risk on returns that fall short of the minimum acceptable return (MAR). An investment with a high downside risk should be compensated with a high expected return.
I wish you enjoy reading this article.
References
- https://corporatefinanceinstitute.com/resources/knowledge/trading-investing/downside-risk/
- https://www.investopedia.com/terms/v/var.asp
- https://www.investopedia.com/terms/c/conditional_value_at_risk.asp
More content at plainenglish.io


