
How to Measure Customer Habit Strength
Three ways of creating habit metrics using customer data

In a previous post on how to manage customer habit disruptions during the pandemic, we recommended that you take stock of the impact of habit disruption on your business. In this article, we expand on that point and show you how habit strength can be turned into meaningful metrics using either consumer transaction/usage data or survey data.
Note: This will be a more technical read.
Two Key Components of Habit
To quickly recap the concept of habit, it is an action that is frequently repeated under the same situations. If we break the concept down, there are two main ingredients to habit:
- Frequency: how frequently does someone take that action (e.g., watches TV, uses a mobile app, etc.)?
- Stability: when the person engages in the action, is it often under the same circumstances (e.g., on the way home, on Sunday morning, etc.)?
To measure how strong a customer’s habit is, you need to be able to quantify these two ingredients. The higher the frequency and the higher the stability, the stronger the habit is.
In the following discussions, we assume that you have individual customer purchase or usage data available. If that is not the case, you can refer to the last section for alternative measures of habit strength using customer surveys.
How to Measure Frequency
Measuring frequency is relatively straightforward. For purchase frequency, it is the number of times someone buys your product in a given time window (e.g., per week, per month, per year, etc.). If you have usage data instead (e.g., customer use of your mobile app), frequency means how many times someone uses the product in a given time length.
Example: Someone buys your product 36 times a year. Average frequency per month = 36/12 or 3 times per month.
While the concept is straightforward, you need to pay close attention to what you choose as the time window for calculating your frequency measure. Let’s say your product is typically needed once a month or so, using week as the time window would be too short to capture differences in repeat patterns, because in most weeks people will not be buying anything. Instead, you’ll want to look at the monthly or quarterly level to get an idea of what the typical frequency is.
On the other side of the coin, if your product is used very frequently, you don’t want your time window to be too wide either. For a product that is used daily, you don’t want your time window to be more than daily or at most weekly, so that the frequency metric is not going to become too big of a number for most customers.
“You need to pay close attention to what you choose as the time window for calculating your frequency measure.”
How to Measure Stability
Identifying the Stability Components to Capture
To measure how stable people’s behaviors are, you need to first decide what you consider as stable context in your setting. In the last post, we talked about four typical types of contextual cues: time, location, social context, and preceding/subsequent event. Researchers have also considered stability in purchase patterns, such as how much the customer buys on promotion, how much he/she buys low-margin products, and how often products are returned. You can look into the content of what customers buy or use as well.
There are no hard and fast rules on what types of stability are the best ones to use. Here are a couple of things that can help you pick the right ones:
- Think about the typical behavior associated with your product and see what it is typically associated with. For example, if you run a coffee shop, time of the day is probably a big factor in your customers’ habit.
- Choose ones that differentiate your customers from each other. Say if you have a low-price strategy and attracts mostly customers who are promotion-minded, you may not want to use how much they buy on promotion as a stability cue, because it lacks the power to tell one customer apart from another.
- Experiment with different stability dimensions and see which ones predict behaviors the best using data analytics.
- Keep in mind your data limitations. Obviously, if you do not capture certain information such as time of use, you won’t be able to gauge stability on the time dimension.
Calculating the Stability Score
Once you figure out the few stability elements you want to capture, the next step is to calculate the stability score associated with each element.
Let’s say you decided that time of day is an important stability component. Your strongly habitual customers typically buy or use the product at the same time of the day. Based on your business, you segment time of the day into five sections: early morning, mid-morning, lunch time, afternoon, evening/late night.
For each customer, you’ll want to see what percentage of that customer’s purchases fall into each segment. Let’s say a customer’s purchase distribution is 90% early morning, 5% mid-morning, 3% lunch time, 2% afternoon, 0% for evening and late night. The time stability for this customer would be the highest of the percentages (in this case 90%). The rationale for this is fairly straightforward. If a customer buys at random times throughout the day, you would see 20% of the customer’s purchases fall into each of the time segments. As a result, that customer’s stability would be 20% instead, much lower than the more habitual one with a 90% stability score.
This same calculation can be made with the other types of stability aspects such as location. Once you have a stability score for each stability dimension, you can create an overall stability score for each customer by averaging the customer’s stability scores across all dimensions. If a certain type of stability (e.g., time) is more important in your business than other stability dimensions (e.g., location), you may want to use a weighted average rather than a simple average.
Combining Frequency and Stability to Create a Habit Metric
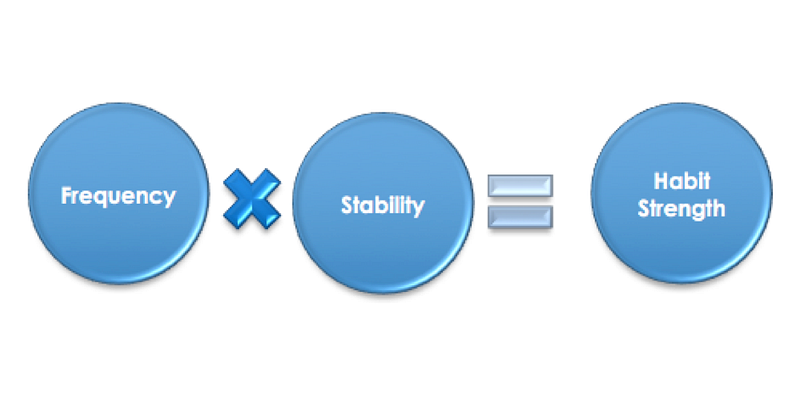
After you have figured out the frequency score and stability score for each customer, calculating habit is straightforward using the formula:
habit strength = frequency score x stability score
Since this is a simple concept, we won’t dwell on it except for one technical note. If your customers have wildly different frequencies (e.g., some with a frequency of 1 and some with a frequency of 200), in order for the frequency portion not to over-dominate the habit metric, you’ll want to log-transform the frequency measure:
transformed frequency score = log(frequency+1)
(The plus 1 is to make sure those with zero frequency can still use the log-transformation.)
After this transformation, the 1 vs. 200 examples above will now be 0.69 vs. 5.3, a much more manageable range. You will then multiply this transformed frequency score with the stability score to arrive at the final habit score.
Below is a research publication where you can see this habit metric being deployed:
- Liu-Thompkins, Yuping and Leona Tam (2013), “Not All Repeat Customers Are the Same: Effects of Attitudinal Loyalty and Habit,” Journal of Marketing, 77 (5), 21–36.
What If You Don’t Have Granulated Customer Data
The approach we described so far is possible only if you have granulated customer-level behavioral data. If you don’t have that information, it is still possible to gauge your customers’ habit strength. But you’ll have to rely on good ol’ self-reported measures using customer surveys.
The downside of this approach is that because habit is supposed to follow an automatic process, people may not be fully aware that they have a strong habit. So they may not rate themselves very high on these measures even if they are strongly habitual. In our experience of using different habit metrics, these self-reported measures tend to correlate with the behavior-based measures at a moderate level (correlations in the 0.3~0.4 range).
Self-Reported Habit Measure #1
Using the same two key ingredients of frequency and stability, you can ask consumers questions related to each of the two components. For frequency, the question may look something like:
“How frequently did you watch this show in the past 30 days?”
For stability, the same advice we discussed earlier should be followed to first identify the contextual stability elements relevant to the situation. Each of these elements should then be phrased into a question, like the examples below.
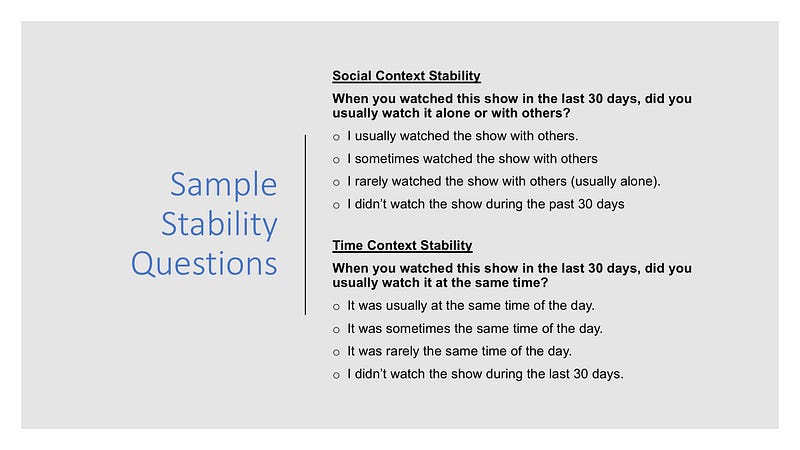
Once you have both the frequency rating and the stability ratings, a similar approach for combining the frequency and stability scores can be followed.
In case you would like to dig deeper, here is the publication where this approach was adapted from:
- “Habits in Everyday Life: Thought, Emotion, and Action” by Wood, Quinn and Kashy, published in 2002 in Journal of Personality and Social Psychology, Vol. 83, №6, p.1281–1297. (Habit measure details are on p.1285)
Self-Reported Habit Measure #2
Finally, psychology research has also created a self-report index of habit strength that can be used to measure customer habit. Below are the 12 items. Consumers would rate their agreement with each of the statements on a commonly used “agree/disagree” scale.
“Watching this show is something …”
- …I do frequently.
- …I do automatically.
- …I do without having to consciously remember.
- …that makes me feel weird if I do not do it.
- …I do without thinking.
- …would require effort not to do it.
- …that belongs to my (daily, weekly, or monthly) routine.
- …I start doing before I realize I’m doing it.
- …I would find it hard not to do.
- …I have no need to think about doing.
- …that’s typically “me”.
- …I have been doing for a long time.
If you are interested in reading the original research that developed this scale, here is the reference and link to the paper on ResearchGate.
- “Reflections on Past Behavior: A Self-Report Index of Habit Strength” by Verplanken and Orbell, published in 2003 in Journal of Applied Social Psychology, Vol. 33, №6, p.1313–1330.
We hope this article helps you solve the technical challenge of operationalizing the concept of habit among your customers. If you have any questions or have suggestions for improving these metrics, please post a response in the comment section below.


