
How to Load Test: A developer’s guide to performance testing
How to design and run load tests using Apache JMeter & Taurus
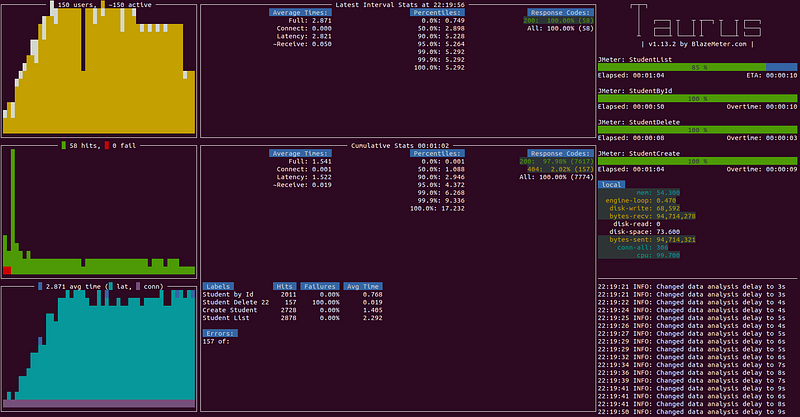
Load Testing is a type of performance testing that measures the performance of a system under varying load over a period of time.
All code is guilty, until proven innocent. — Anonymous
Objective
The purpose of this article is to help you design and run load test 👍
Why Learn?
As developers we already have the foundational knowledge and with a little effort we could expand our skillset.
- Your company cannot afford to hire performance engineers
- Not enough testers compared to developers
- The skill & knowledge could help you write better and scalable code
- Less dependant on other’s expertise

Why Load Testing?
While unit & integration tests ensure code is functionally correct, load testing measures its performance which is equally important.

Only a Load Test can shed light into concurrency issues, whether the database queries make good use of indexes instead of a full table scans, where are the bottlenecks, does the application scale efficiently, what is the application’s response time and throughput and so on.
Getting Started Apache JMeter
In this section we will design and run Apache JMeter load tests.
Environment Setup
For environment, either find a suitable online resource (not recommended), come up with your own simple service (node, python, whatever) or simply use the web service provided in this article.
We will be using a simple java-based spring boot web service that exposes four (4) endpoints. The requirement are Java 1.8 and Apache Maven.
git clone https://github.com/rhamedy/tinyservice4loadtest.gitcd tinyservice4loadtestmvn spring-boot:runApache JMeter
Please go ahead and install Apache JMeter from download site, unzip and execute the following command
apache-jmeter/bin/jmeter.sh // Linux & MacOSapache-jmeter/bin/jmeter.bat // Windows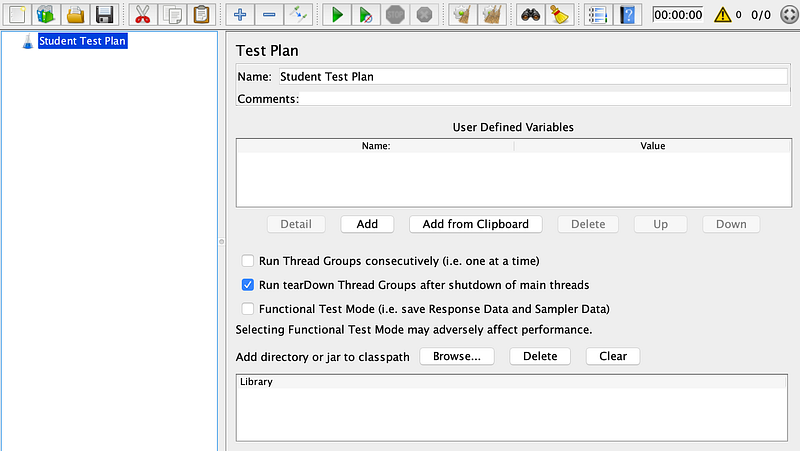
Design a Test Plan for Apache JMeter
Let’s load test the following apis
http://localhost:8080/students/list - [GET] List studentshttp://localhost:8080/students/id - [GET] Get student by idhttp://localhost:8080/students - [POST] Create student
http://localhost:8080/students/id - [DELETE] Delete student by idAll the sample tests for above endpoints are available in the GitHub repository.
Step 1 — Right click on test plan and pick Add > Threads (Users) > Thread Group. A test plan must have at least 1 Thread Group.
- The
Number of Threads (users) - The
Ramp-Up period (in seconds). How long to reach the max users? - How many times or for how long to run the test
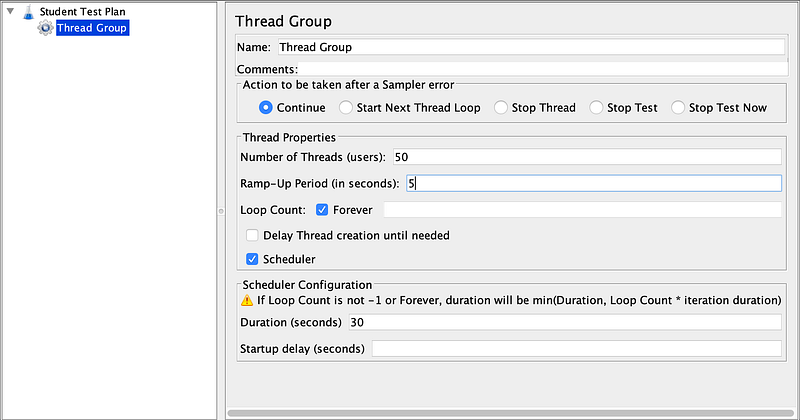
Step 2 — Let’s specify what to test. Right Click on ThreadGroup and select Add > Config Elements > HTTP Request Defaults option.
Config Elements are useful if you wish to share configuration among one or more requests for example i.e. server address, port number, token, etc.
Let’s fill out the HTTP Request Defaults Config element

Also let’s add an HTTP Header Manager via Add > Config Elements > HTTP Header Manager for Content-Type header
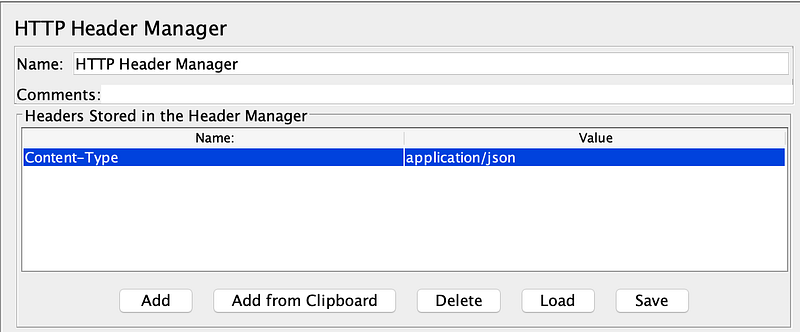
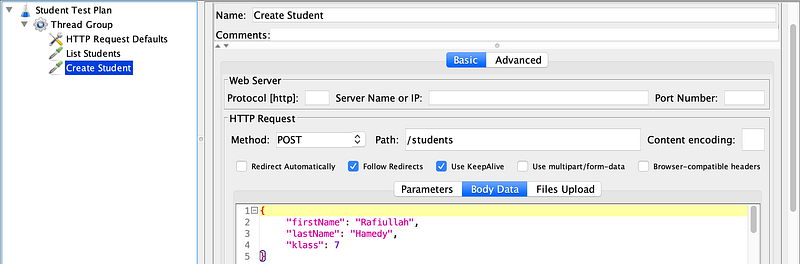
Step 3 — Let’s configure the http requests, Right Click on the ThreadGroup and select Add > Sampler > HTTP Request
- What is the method type i.e.
GETorPOSTetc - What is the api path i.e.
/students/listor/studentsetc

Right click to duplicate a request and update it.
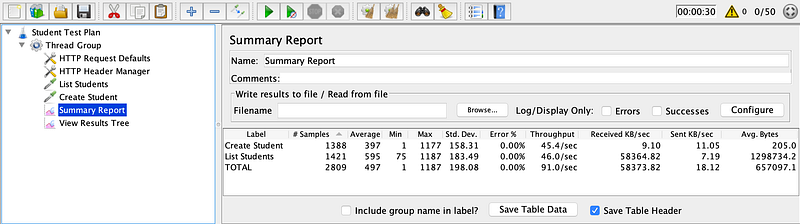
Step 4 — The Listeners are used to collect results. Right Click on ThreadGroup and select Add > Listener > Summary Report option.
The test plans in words, we create an Apache JMeter Test Plan to Load Test two apis with 50 Users with a ramp-up for a duration of 30 seconds.
If you have the tinyservice4loadtest (or your own) running, then let’s hit the play button and see the results in Summary Report
Run Apache JMeter Test Using CLI
The GUI is not recommended for running complex tests. Let’s open a complex sample test from here.
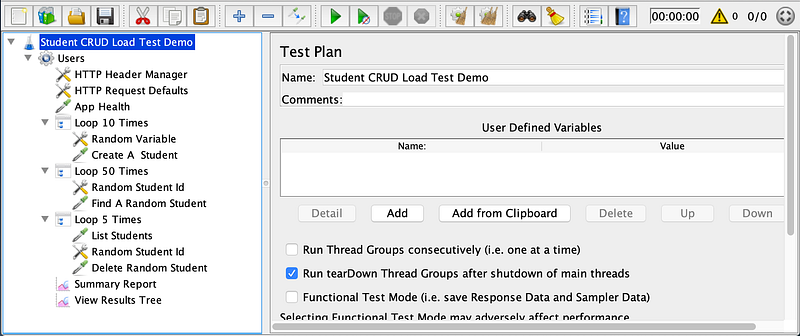
The above test plan has more elements
- The
Random Variablegenerates a value between x and y - The
Loop Controllerexecutes the content of loop x times
To generate a meaningful report we need user.properties (Source) in the directory where .jmx test is.
jmeter.reportgenerator.report_title=Apache JMeter Dashboard
jmeter.reportgenerator.overall_granularity=60000
jmeter.reportgenerator.graph.responseTimeDistribution.property.set_granularity=100
jmeter.reportgenerator.apdex_satisfied_threshold=1500
jmeter.reportgenerator.apdex_tolerated_threshold=3000
jmeter.reportgenerator.exporter.html.property.output_dir=/tmp/test-jmeter.reportgenerator.exporter.html.filters_only_sample_series=true
Run the test script using command (output-directory should be empty)
jmeter.sh -n -t loadtest.jmx -l log.jtl -e -o output-directoryIn the above command the -n stands for no gui the -t indicates the scripts loadtest.jmx the -l is for log.jtl where -e and -o are for reporting.
The output-directory will contain a bunch of files including an index.html that opens the graphical results of the test as shown below.
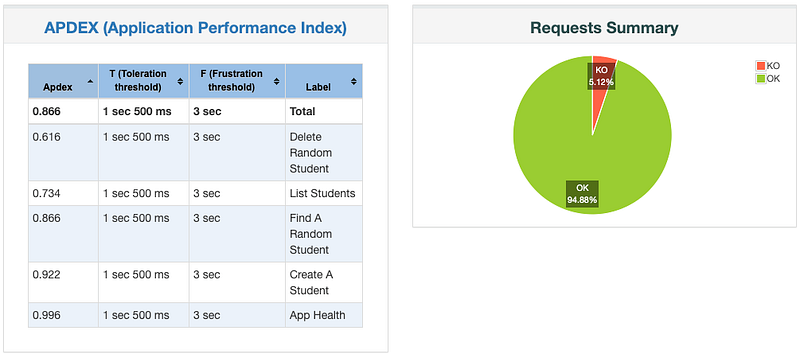
In this graph the left side is APDEX and the right side is Request summary. The red indicates all our 404 errors and the green is 200 successful requests.
Some numbers relating to Number of samples, Response time, Throughput
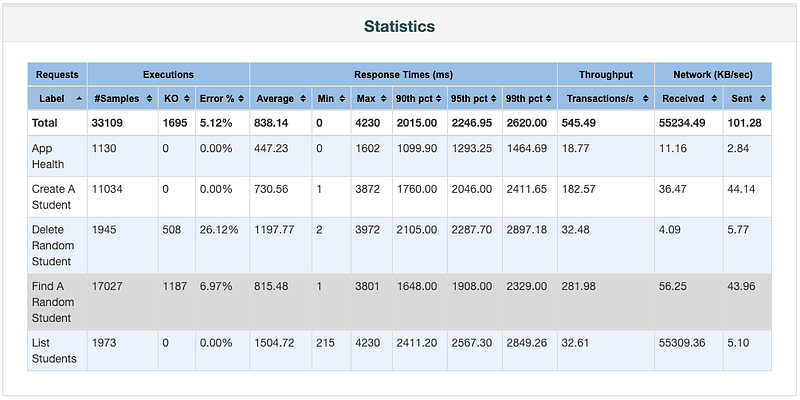
Most importantly the Response Time and Throughput
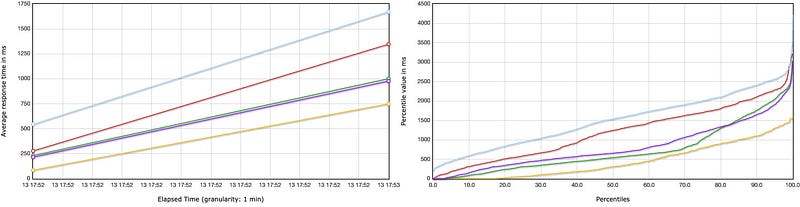
Lastly, it’s worth-mentioning that Apache JMeter can be configured to listen to a browser’s activity and capture the network request. For details see here.
Getting Started with Taurus
Now that we know how to use Apache JMeter to run a basic load test, let’s explore open-source framework Taurus. In short, one of the reasons for birth of Taurus was because Apache JMeter has a steep learning curve and Taurus make things a lot simpler.
Taurus is an abstraction layer (or a wrapper) on top of Apache JMeter and that means you can run an Apache JMeter script using Taurus. So go ahead and install Taurus using the easy to install instruction
The Taurus scripts can be written in YAML or JSON using follow blocks
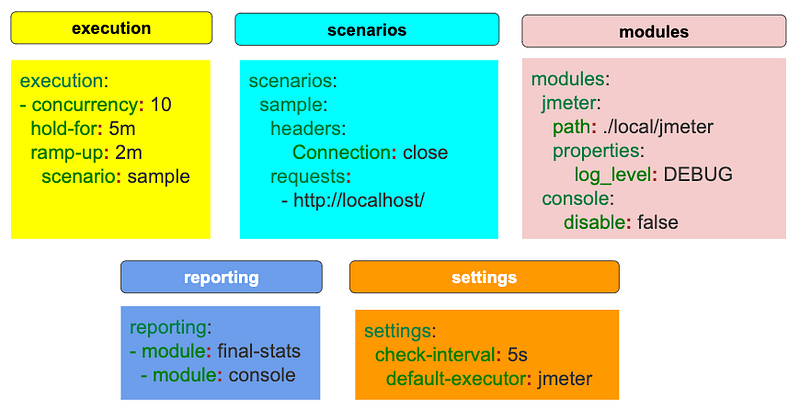
Scenarios is basically where one or more requests are defined. For each scenario an execution is defined with props such as no of users, duration, ramp-up period and so on. The modules allow us to configure executor that could be Apache JMeter , Selenium and so on. Likewise, the reporting allows configuring how the report should be generated i.e. csv, live reporting in console, or push the result to the blazemeter website.
scenarios:
 StudentList:
  requests:
   - url: http://localhost:8080/students/list
label: Student Listexecution:
- scenario: StudentList
concurrency: 15
ramp-up: 2s
hold-for: 10sreporting:
- module: console
- module: final-stats
summary: true
percentiles: true
test-duration: true
dump-csv: single_scenario_single_req.csvLoad test /students/list api reaching 15 users within 2s (ramp-up) for a duration of 10s and display live result in the console as well as csv file.
To run the Taurus test (sample provided here), simply run the command bzt test.yaml
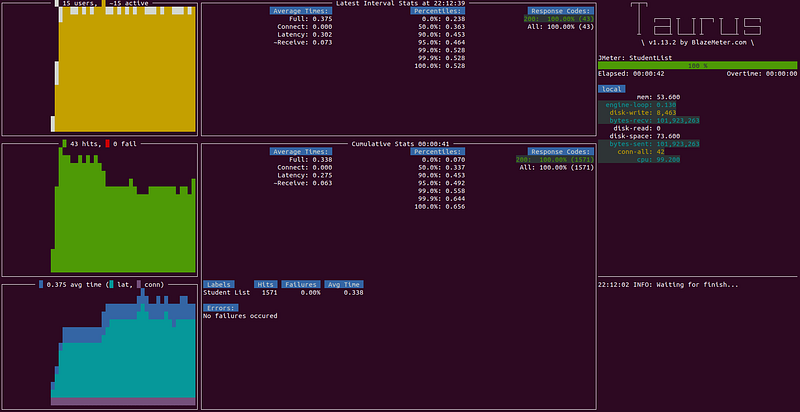
In a Taurus test you can also configure a scenario to point to an Apache JMeter script and override execution and other parameters.
scenarios:
 JMeterExample:
  script: student_crud_jmeter.jmx
Taurus seems to be a very interesting framework and it is worth checking it out. It is very well-documented here.
Conclusion
I highly recommend checking out Apache JMeter and Taurus documentations if you wish you learn more techniques and tricks.
I have previously authored the following article explaining some of the key habits and things I wish I knew earlier in my career as a developer
I have also authored an article on how to setup JaCoCo code coverage tool using Maven and Gradle for java-based projects
and if contributing to open-source is something you are interested in then, you might find the following article helpful
You can follow me on Medium for more articles, connect with me on LinkedIn and Twitter.


