
How to learn data analysis with ChatGPT?
Learn data analysis with ChatGPT. It is easy to learn some of the fundamental Pandas concepts with ChatGPT.
Learning data analysis skills has been made easier by ChatGPT. It is easy to learn fundamental data analysis skills with ChatGPT. Learning Python pandas fundamentals can at first seem daunting, not because of the difficulty of the language but purely because of the volume of content that is out there for one to follow. I introduced a concept called Minimal Viable Analytics (MVA) in another post which will help you to identify the most important concepts you will use over and over again in your analytical journey. I strongly suggest you have a look at that post when you get some time:
I discuss that building analytics is analogous to building a house with an MVA foundation, MVA pillars, and a MVA roof. In the MVA pillars, I also introduced some core skills that every analytics professional should be familiar with and provided reference posts that would definitely help you develop those skills. With the rise of Large Language Models(LLM) in the form of ChatGPT and others, there is a question on whether one could utilize LLMs to learn some of the fundamental core concepts of the MVA pillars. So the answer is yes you can. So let’s get familiar with the six core concepts that I introduced:
- Grouping or aggregation of data
- Filtering and slicing data
- Sorting data
- Merging data
- Creating new columns
- Creating graphs
So I asked ChatGPT these concepts as questions and let’s see what the outcome it produced.
1. Grouping or aggregation of data
Grouping and aggregation are important concepts to master. So I asked the question “How do you group data in pandas with python”? I tried it a couple of times. There were slight differences with the output but the response was very similar to the response in Figure 2.
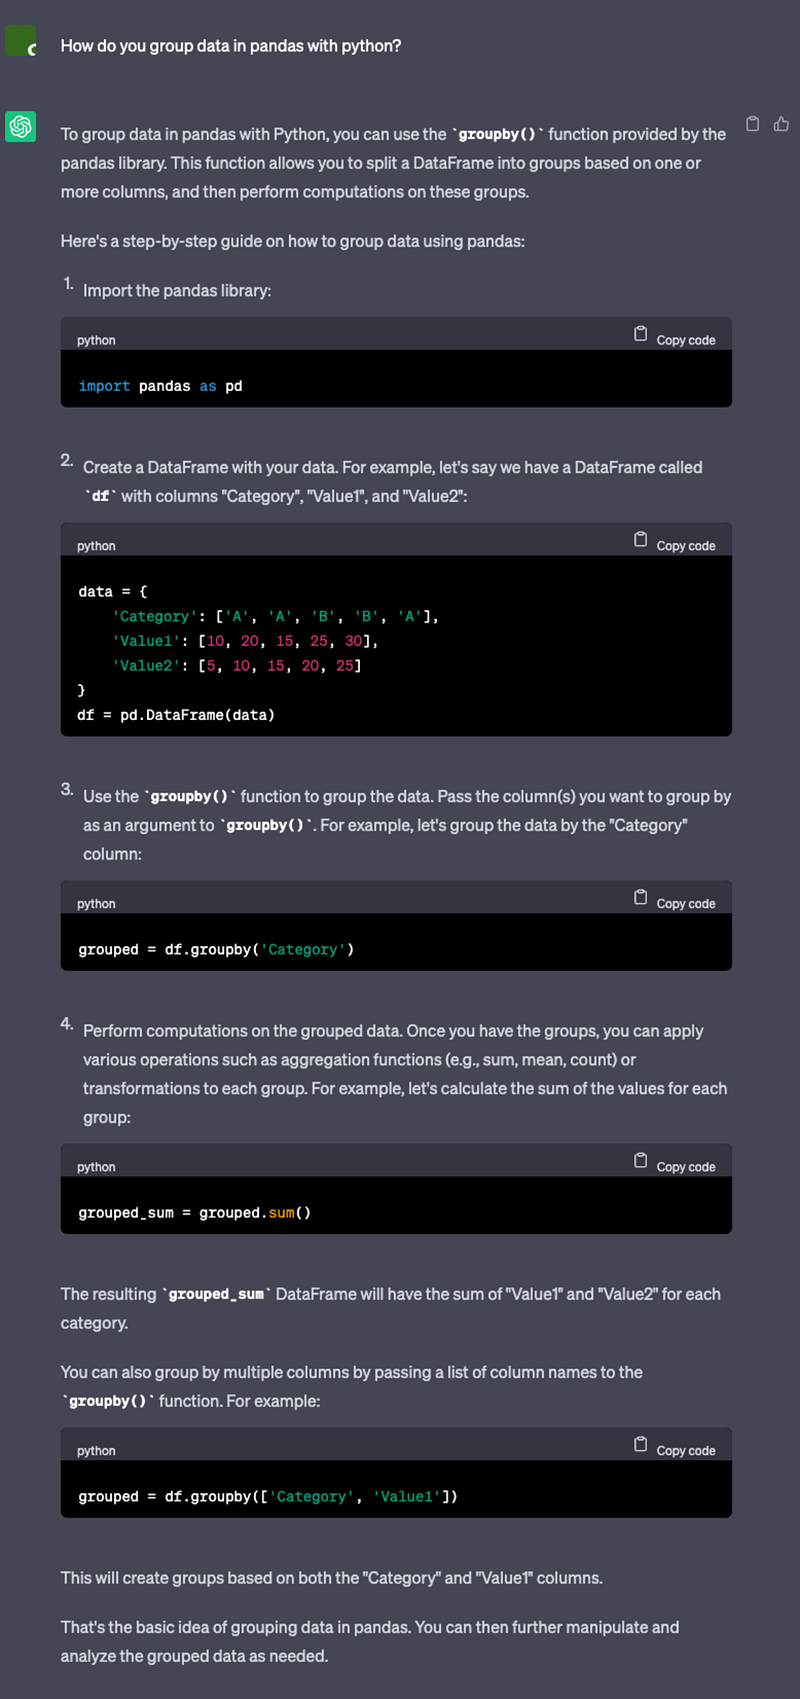
Figure 2 shows the output from ChatGPT for grouping pandas data. My initial thoughts are that it is very impressive. One of the key differences between putting a question in a search engine and ChatGPT is that ChatGPT clearly identifies the dominant solution. This is good and bad, at the same time because you are directed to one solution. You may not consider all the different alternatives out there. Nevertheless, it provides a working example, it shows how to generate an aggregated value and how to group by multiple columns. But as you can see it doesn’t show details about missing information or how grouping gets impacted by missing information. So you will have to know that information beforehand and ask ChatGPT missing information related specific questions. If you are keen to know about grouping data with missing information I would suggest that you have a look at my post :
This will give you a better idea before you ask the question from ChatGPT on how missing data is grouped in pandas. Let’s move on to the next core skill.
2. Filtering and slicing data
Filtering and slicing data are important concepts to master for any data analytics professional. It forms part of our everyday activities. It is important to be able to understand what each data point represents for the business. Let’s ask the question “How do you filter and slice data in pandas with python” from ChatGPT.
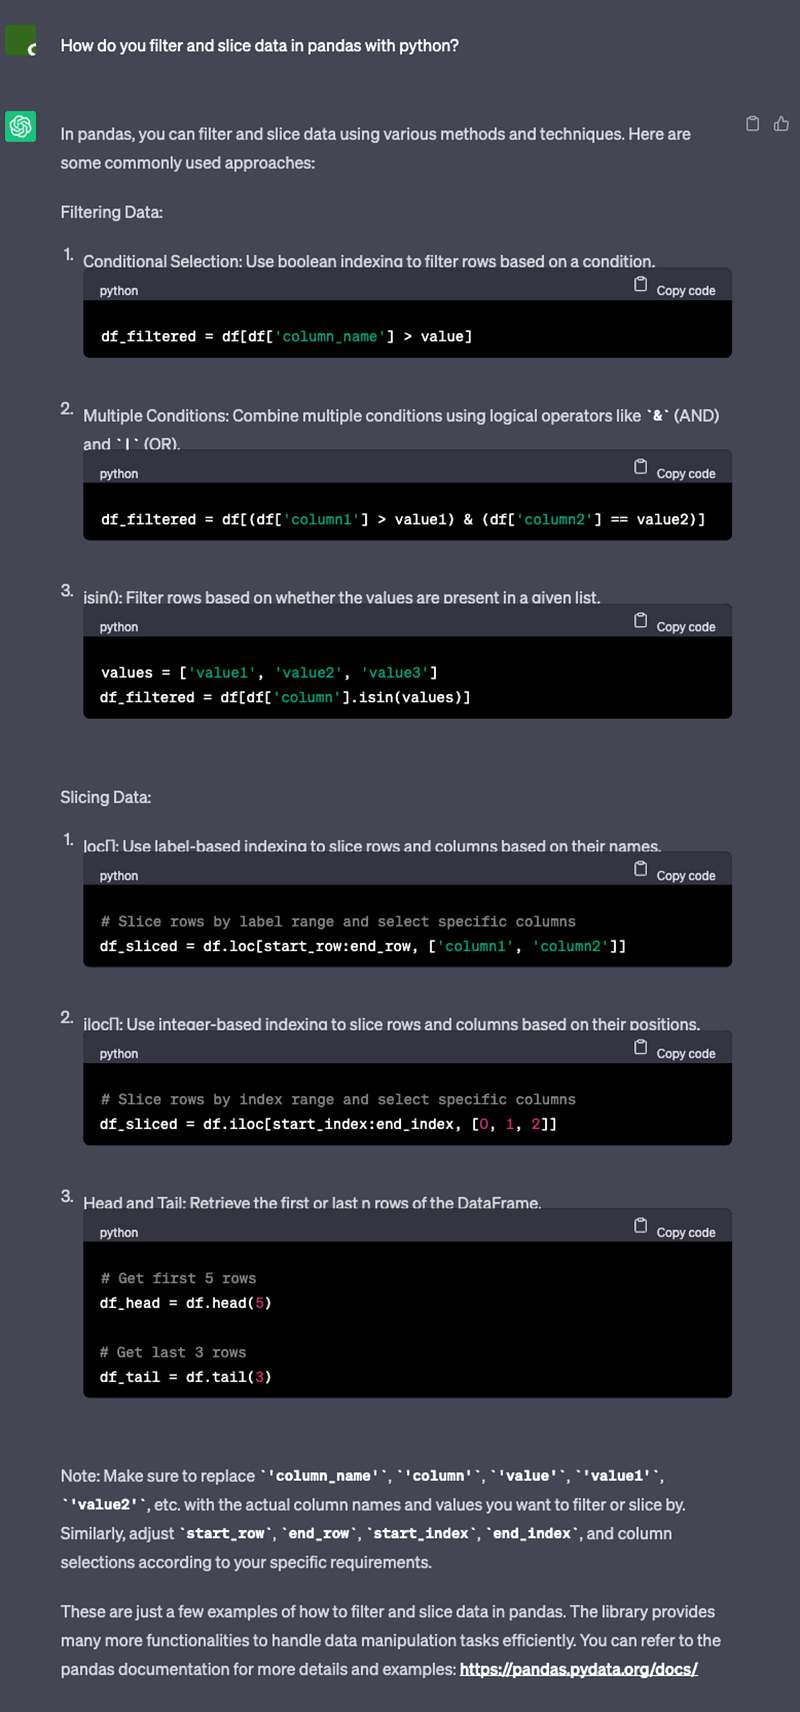
Figure 3 shows the results from ChatGPT for filtering pandas data. This time it didn’t give a working example. So not as good as before. But it goes through the different ways to filter data using logic and how you can slice data with iloc and loc. Because the topic is a bit long it appears to have summarised the concepts. Also, it has missed an important concept that you can pass logical conditions into both iloc and loc. If you are keen to know more as a starting point I strongly recommend you have a look at the following post that I have created :
Next, we will move on to another core concept.
3. Sorting data
Sorting data allows you to order data in a way that is meaningful to an objective. The ability to sort data allows you to identify one entity to be more valuable than the other. Let’s ask ChatGPT “How do you sort data in pandas with python?”.
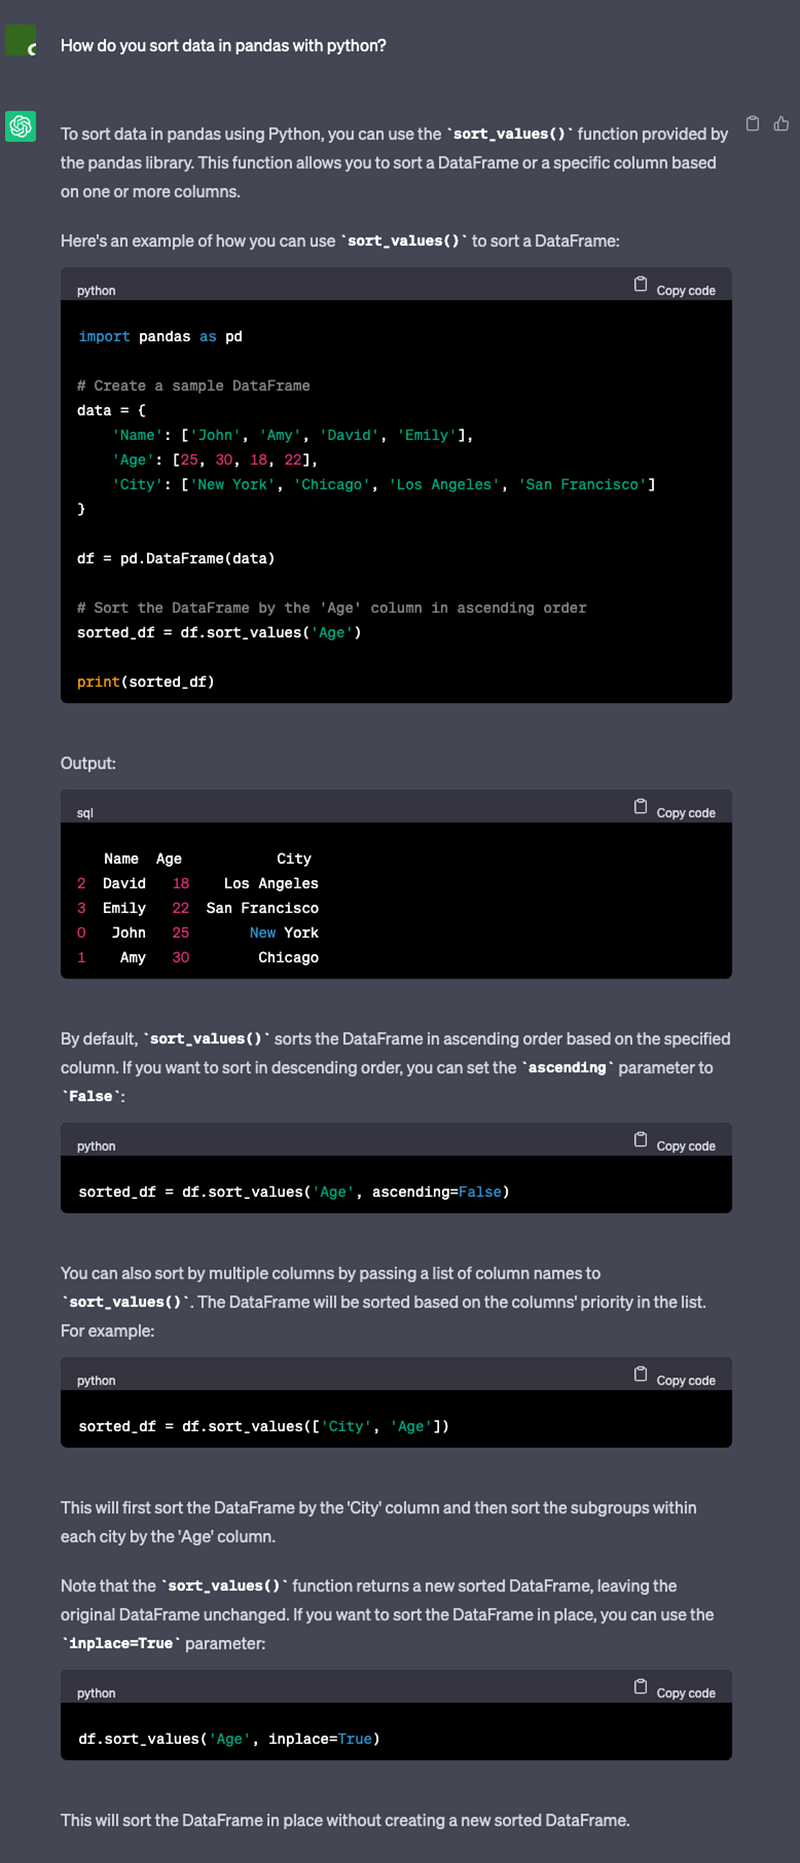
Figure 4 shows the output from ChatGPT on how to sort pandas data frames. This time around it did give an example and pretty much showed most of the concepts related to sorting. That is sorting in both ascending and descending order and sorting by multiple columns. If you like a bit of in-depth information on how pandas treat upper and lower-case characters and dates when sorting have a look at my post:
Let’s try to move on to the next important core skill.
4. Merging data
Merging data is another important difficult skill to master when you are starting out. It is important to know the different ways that data could be merged and how the data with duplication gets treated. Let’s see how ChatGPT responds to the question “How to merge data in pandas with python?”
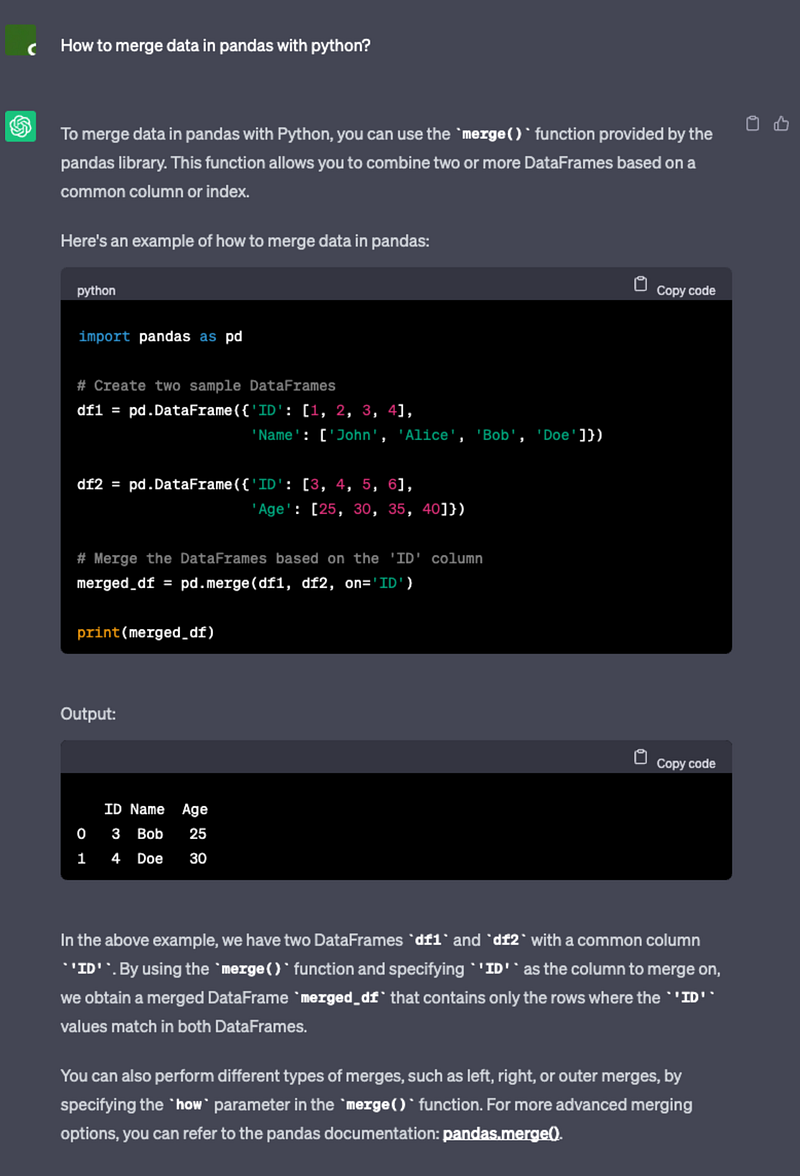
Figure 5 shows the chatGPT output on how to merge data with pandas. This is one output I would think is not the best. It does go through an example which is great. However, it doesn’t discuss much or expose much about how the merged result is obtained. There is a reference to the other different types of joins but there appear that significant pieces of information that are missing. To get a better overview of merging I recommend that you have a look at my post:
You will learn how to conduct multiple different joins with examples. This post goes into more detail about the different joins and shows with Venn diagrams how each type of join can be used to merge data. Let’s move on to the next core skill.
5. Creating new columns
Creating new content involves combining pieces of information and then adding that information as a new column. This can be creating a simple calculated column like adding values in two columns to something more complex like conducting complex calculations using multiple data sources and adding the calculated values to the new column. Either way, it is important to figure out how to create new columns and how to insert calculated results onto those columns. Let’s ask ChatGPT how to create new columns in pandas.
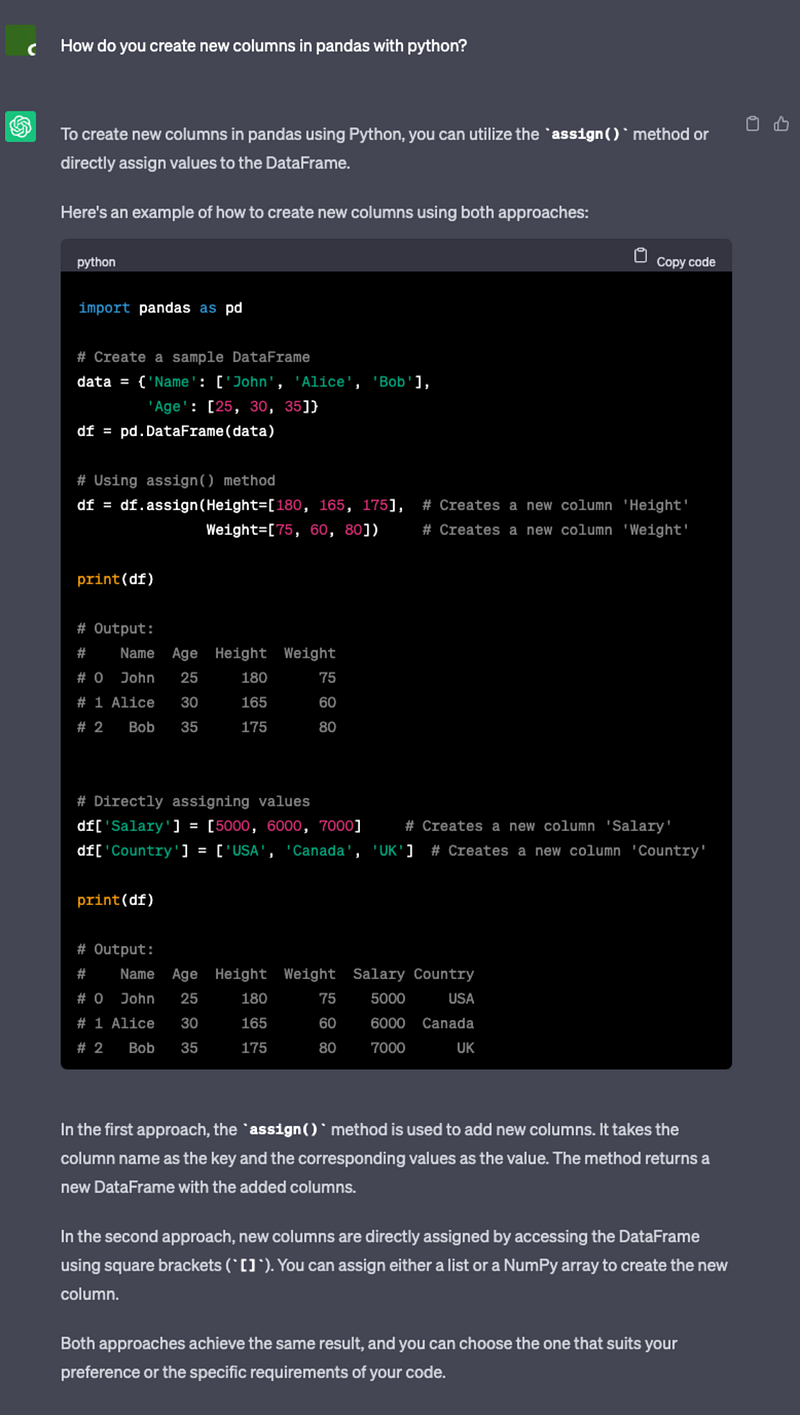
Figure 6, shows the output from asking ChatGPT on how to create a new column. It provides two approaches the .assign approach and the direct assignment of values approach. The usage .assign is not preferred as you need to copy the whole data frame to a new data frame with the additional column. This can get tedious and after a while, you will run out of memory as you would have created multiple copies of the same data frame. The direct method is preferred. Also, ChatGPT has ignored the loc method of creating columns. So if you would like to find out more have a look at my blog post :
You will learn how to create new columns, create categorical columns and create one-hot encodings of a categorical column. Let’s get on to the last core skill.
6. Creating graphs
Creating graphs is one of the most important skills you need to learn in analytics. It is an acquired skill and you will learn to convey your message more effectively every time with each graph generated. Let’s ask ChatGPT “How to create a graph in pandas with python?”.
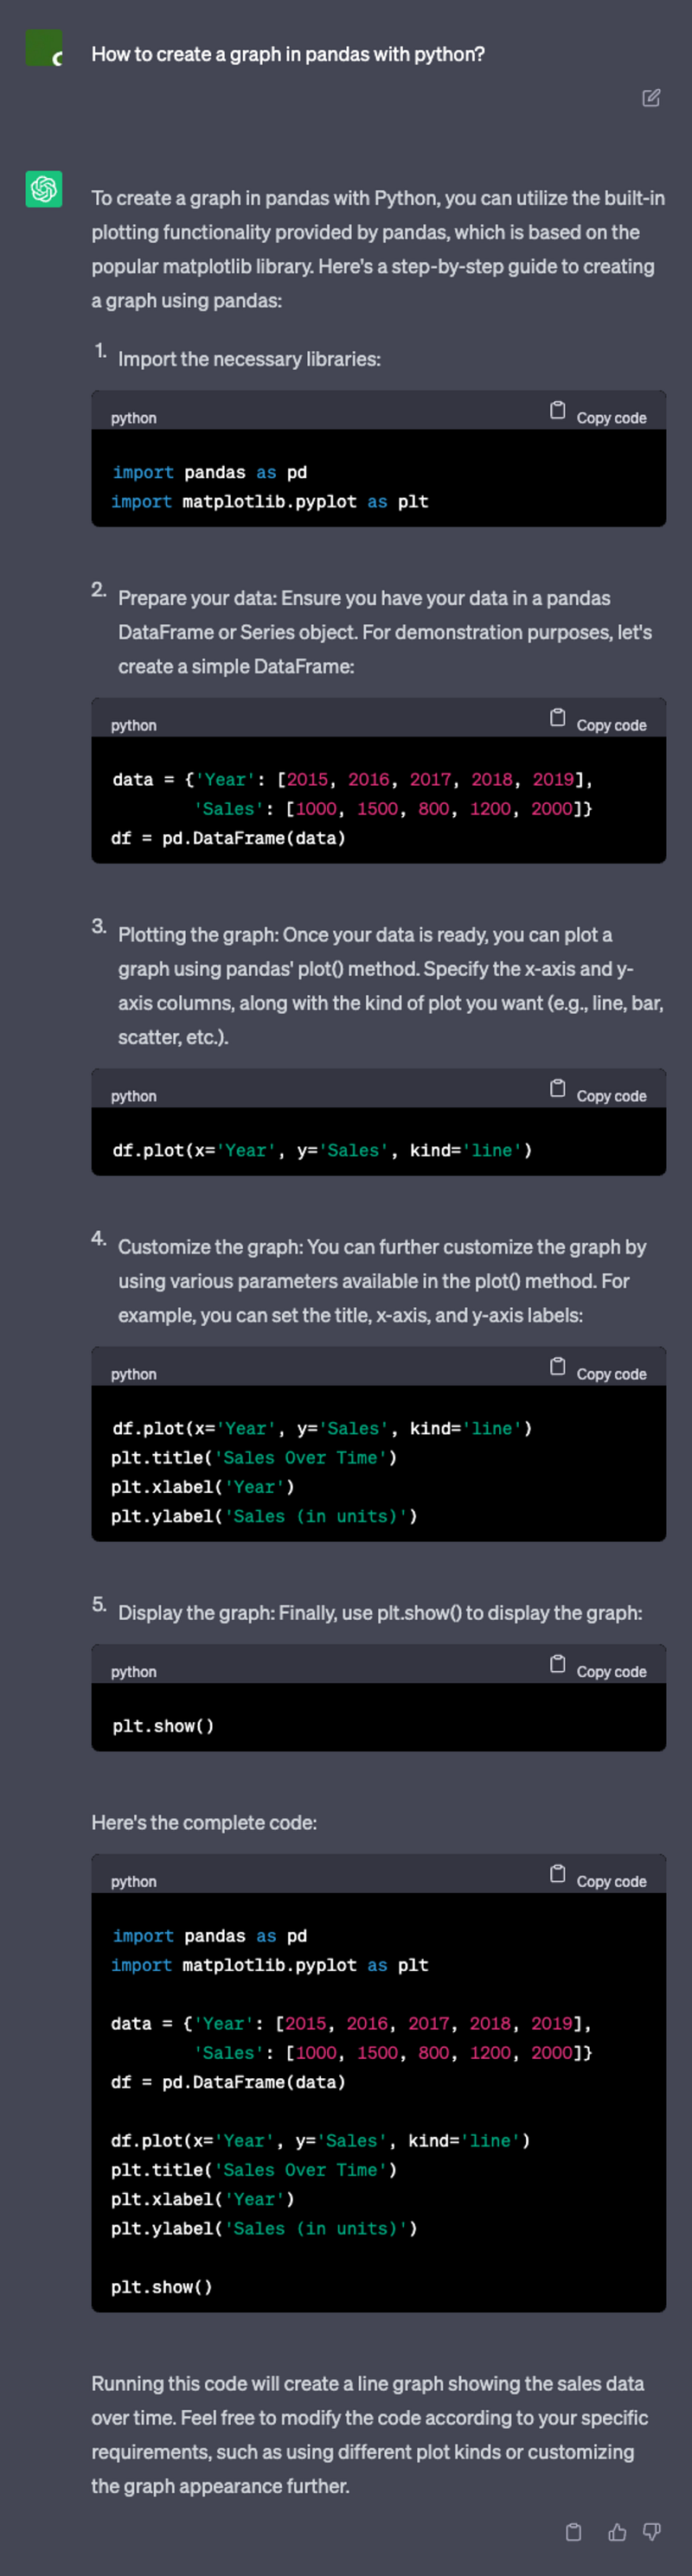
Figure 7 shows the output from ChatGPT on plotting graphs in pandas. Here we get a nice example but we don’t see the end result as a graph. The preferred solution that ChatGPT directs you to use includesmatplotlib and DataFrame.plot() methods. Here there are a lot of things missing. There are many different ways to visualise the data. Also, there are many different ways to plot with different Python packages. So you would need to dig deeper before you end up on the correct solution path. As a start, I would recommend that you have a look at my blog posts:
- Python Pandas Fundamentals: Create simple graphs
- Python Pandas Fundamentals: Which graphing approach is better? maplotlib or seaborn or DataFrame.plot()
You will learn how to create a simple plot with matplotlib.pyplot, plot data from a pandas data frame with matplotlib.pyplot, create a graph using axes.plot, create a graph using pandas internal DataFrame.plot(), and create a graph using seaborn. Note this is a simple introduction to graphing it is now your time to explore.
Concluding remarks about learning with ChatGPT
Asking a simple question on ChatGPT gets you the dominant solution that is close to answering that question. If you are learning Python fundamentals with little to no knowledge from the beginning you would get a lot out of the ChatGPT output. However, you will realise through your analytics journey that the dominant answer is not always the best answer and you need to tease the answer for the situation you are managing. You would need to tickle the beast to get the answer you are after. The ChatGPT beast will have to be tickled in the correct way to answer some of the in-depth solutions. ChatGPT is a great tool to learn the fundamentals. I emphasize “tool” here as there is more topics to drill down to and niche areas to explore. ChatGPT doesn’t cover all these niche areas in one hit. You would need to find out what those areas are first before you can ask those questions from ChatGPT. It is important to treat it as a tool and add it to your tool kit and not throw away all your other tools. If you throw away all your other tools, that is the day you become a slave to this beast. Do you agree with my view? If you found any of the content helpful follow me. I will try to add more similar content in the future. Until next time happy learning.
Grab a cup of coffee, relax, and join the medium community here to expand your knowledge and thinking.🧠


