How to Install Grafana Loki using HELM
If you have opened this link you know the importance of writing logs in your applications. In production environment limited people have access to that is why as a good practise logs are logged in different server. What happens if you have gigabytes of logs to sift through doing it manual you will missing something important.

Introduction
There are several tool that can used for logging, we will be using installing Loki. Loki can be deployed in three different ways depending with the size of your logs
Monolithic Simple Scalable Microservice
Monolithic
- Description: Single process handling all functions. Easy to set up and manage, suitable for small to medium workloads.
- Use Case: Ideal for small teams or environments with low to moderate log volumes.
- Scalability: Limited scalability
Simple Scalable
- Description: Multiple instances with a straightforward configuration. Allows for more scalability compared to monolithic mode.
- Use Case: Suitable for medium to large environments where log volumes are higher and some level of scaling is required.
- Scalability: Better scalability than monolithic mode.
- Redundancy: Multiple instances provide redundancy and increase reliability
Microservice
- Description: Fully decoupled components, each handling specific functions (ingestion, storage, query, etc.). Allows for horizontal scaling of individual components.
- Use Case: Ideal for large-scale deployments with very high log volumes and complex query requirements.
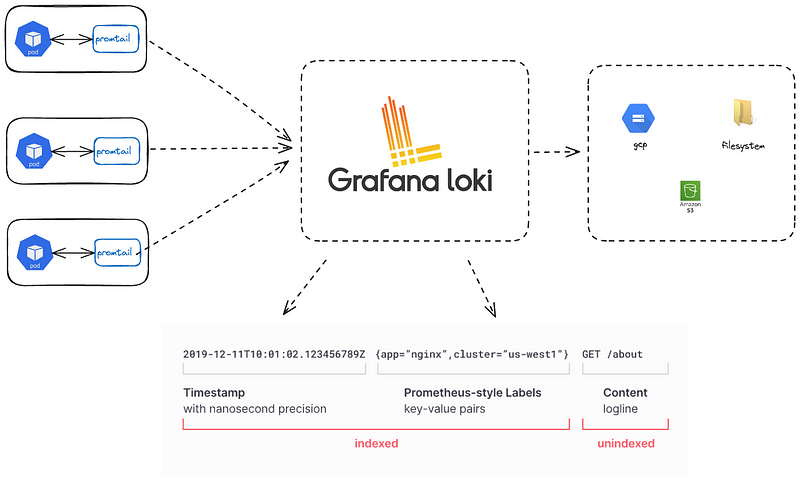
Components of Loki
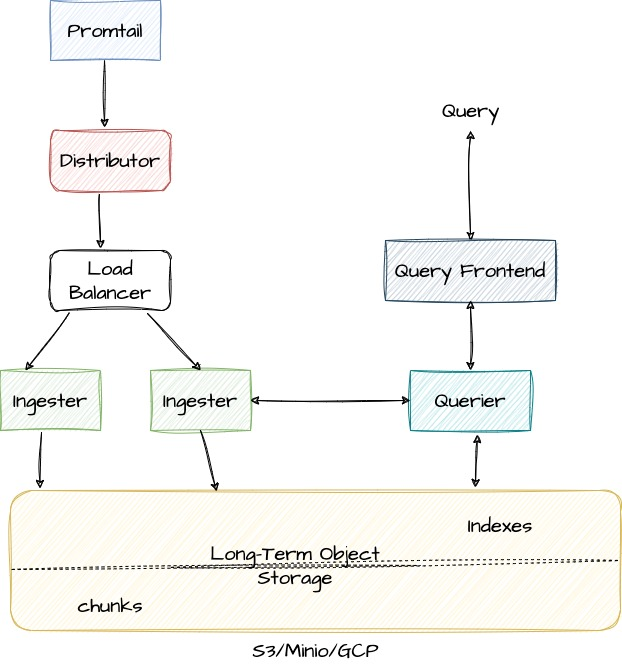
On high level, this is the Write path
- The distributor receives an HTTP POST request with streams and log lines.
- The distributor hashes each stream contained in the request so it can determine the ingester instance to which it needs to be sent based on the information from the consistent hash ring.
- The distributor sends each stream to the appropriate ingester and its replicas (based on the configured replication factor).
- The ingester receives the stream with log lines and creates a chunk or appends to an existing chunk for the stream’s data. A chunk is unique per tenant and per label set.
- The ingester acknowledges the write.
- The distributor waits for a majority (quorum) of the ingesters to acknowledge their writes.
- The distributor responds with a success (2xx status code) in case it received at least a quorum of acknowledged writes. or with an error (4xx or 5xx status code) in case write operations failed.
Read path
- The query frontend receives an HTTP GET request with a LogQL query.
- The query frontend splits the query into sub-queries and passes them to the query scheduler.
- The querier pulls sub-queries from the scheduler.
- The querier passes the query to all ingesters for in-memory data.
- The ingesters return in-memory data matching the query, if any.
- The querier lazily loads data from the backing store and runs the query against it if ingesters returned no or insufficient data.
- The querier iterates over all received data and deduplicates, returning the result of the sub-query to the query frontend.
- The query frontend waits for all sub-queries of a query to be finished and returned by the queriers.
- The query frontend merges the indvidual results into a final result and return it to the client.
Installation
1.Add Grafana’s chart repository to Helm:
helm repo add grafana https://grafana.github.io/helm-chartsThis whole value file we need
loki:
  schemaConfig:
    configs:
      - from: 2024-04-01
        store: tsdb
        object_store: s3
        schema: v13
        index:
          prefix: loki_index_
          period: 24h
  ingester:
    chunk_encoding: snappy
  tracing:
    enabled: true
  querier:
    # Default is 4, if you have enough memory and CPU you can increase, reduce if OOMing
    max_concurrent: 4


deploymentMode: SimpleScalable #SingleBinary for monolithic

backend:
  replicas: 3
read:
  replicas: 3
write:
  replicas: 3

# Enable minio for storage
minio:
  enabled: true

# Zero out replica counts of other deployment modes
singleBinary:
  replicas: 0

ingester:
  replicas: 0
querier:
  replicas: 0
queryFrontend:
  replicas: 0
queryScheduler:
  replicas: 0
distributor:
  replicas: 0
compactor:
  replicas: 0
indexGateway:
  replicas: 0
bloomCompactor:
  replicas: 0
bloomGateway:
  replicas: 0
Lets split it up
loki:
  schemaConfig:
    configs:
      - from: 2024-06-01 #The date from which this schema configuration applies.
        store: tsdb
        object_store: s3
        schema: v13
        index:
          prefix: loki_index_
          period: 24h #The time period for creating new index tables, here 24h (daily).
Critical factor to note here store:`tsdb` Time Series Database, you read more about it here object_store: `s3` which is for Amazon Simple Storage Service (S3) but you change this to
- GCS (
gcs): Google Cloud Storage. - Azure Blob Storage (
azure): Azure Blob Storage provided by Microsoft Azure. - Filesystem (
filesystem): Local filesystem storage. Suitable for testing or small-scale setups, not recommended for production. - Cassandra (
cassandra): Apache Cassandra database, suitable for highly scalable distributed storage. - Bigtable (
bigtable): Google Cloud Bigtable. - DynamoDB (
dynamodb):Amazon DynamoDB. - Swift (
swift): OpenStack Swift object storage
  ingester:
    chunk_encoding: snappy
In Loki, the chunk_encoding field specifies the type of encoding to use for compressing log data chunks. While snappy is a popular choice due to its balance between compression speed and efficiency, there are other alternatives you can use. Here are the available options:
snappy: A fast compression algorithm that offers good compression ratios and high-speed encoding/decoding.gzip:A widely used compression algorithm that provides better compression ratios compared tosnappybut at the cost of slower compression and decompression speeds.lz4: An extremely fast compression algorithm that offers faster speeds thansnappybut usually at the expense of a slightly lower compression ratio.zstd: A modern compression algorithm that provides a good balance between compression ratio and speed. It often achieves better compression ratios thansnappyandlz4, with speeds competitive tosnappy.
deploymentMode: SimpleScalable #SingleBinary for monolithic Distributed for microservice- SingleBinary: All Loki components run in a single process; suitable for small to medium deployments.
- SimpleScalable: Multiple instances with a straightforward configuration for better scalability; suitable for medium to large environments.
- Distributed: Fully distributed microservices architecture with each component running separately; ideal for large-scale, high-volume environments.
Other values change depending on deployment mode selected
# Zero out replica counts of other deployment modes
singleBinary:
  replicas: 0

ingester:
  replicas: 0
querier:
  replicas: 0
queryFrontend:
  replicas: 0
queryScheduler:
  replicas: 0
distributor:
  replicas: 0
compactor:
  replicas: 0
indexGateway:
  replicas: 0
bloomCompactor:
  replicas: 0
bloomGateway:
  replicas: 0
By explicitly setting these replicas to zero, the configuration avoids unintended overlap or conflict between different deployment modes, ensuring a clean and efficient deployment aligned with the SimpleScalable architecture.
Apply the values file on your helm command
After run this command
helm install loki grafana/loki -f values.yml
From the location where you have values.yml or
Configure an agent to send data to loki
Promtail
Get the default value file
helm show values grafana/promtail > promtail_values.yml Add the following
clients:
- url: http://loki-gateway/loki/api/v1/push
# -- Configures where Promtail will save it's positions file, to resume reading after restarts.
# Must be referenced in `config.file` to configure `positions`
scrape_configs:
- job_name: system
static_configs:
- targets:
- localhost
labels:
job: varlogs
__path__: /var/log/*log
- job_name: kubernetes
kubernetes_sd_configs:
- role: pod
relabel_configs:
- source_labels: [__meta_kubernetes_pod_node_name]
target_label: node
- source_labels: [__meta_kubernetes_namespace]
target_label: namespace
- source_labels: [__meta_kubernetes_pod_name]
target_label: pod
- source_labels: [__meta_kubernetes_pod_container_name]
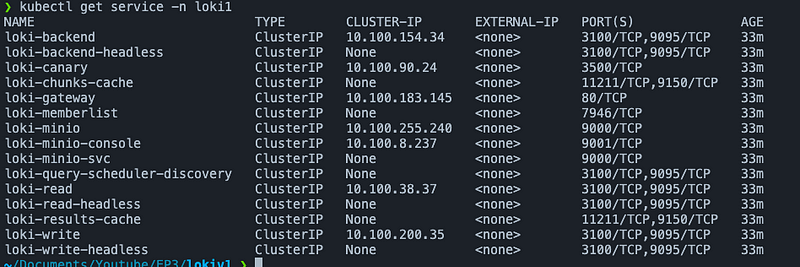
target_label: containerThe above yaml config show where promtail should push its logs counter check on kubectl if the service name is the correct as your kubectl get svc -n loki1
Grafana
Install grafana
helm install grafana grafana/grafana
Default user: admin Password
kubectl get secret grafana -o jsonpath="{.data.admin-password}" | base64 --decode


