
Data Visualisation
How to insert a Python graph into an HTML Web Site
A short tutorial to integrate graphs built in Altair or Plot.ly with an HTML Web site

As many people know, Python is a very powerful language for data manipulation, including data collection, data analysis and data visualisation. Regarding this last aspect, many powerful libraries and frameworks exist, such as the Plot.ly graph library and Altair.
The Plot.ly graph library is a very powerful library, which permits to build graphs and maps in Python, R and Javascript. Altair is another declarative statistical visualisation library for Python, based on Vega and Vega-lite.
In this tutorial, I suppose that you already know how to build a graph using either Plot.ly or Altair. I will illustrate only how to integrate an existing graph with an HTML Web Site.
Three steps are required to integrate a Python graph into an HTML Web site:
- generate the graph either in Plot.ly or Altair
- save the graph as an HTML page
- manipulate the generated HTML
Plot.ly
Firstly, I build a generic graph in Plot.ly. In this specific example, I consider as input data the time series regarding the number of positive cases to COVID-19 in Italy. I plot a line, exploiting the following Python code:
import plotly
import plotly.graph_objs as go
import pandas as pd
df = pd.read_csv('https://raw.githubusercontent.com/pcm-dpc/COVID-19/master/dati-andamento-nazionale/dpc-covid19-ita-andamento-nazionale.csv')# Create a trace
data = [go.Scatter(
x = df['data'],
y = df['totale_positivi'],
)]layout = go.Layout(
xaxis=dict(
title='Data',
),
yaxis=dict(
title='Totale positivi',
)
)
fig = go.Figure(data=data, layout=layout)The following figure shows the produced output:
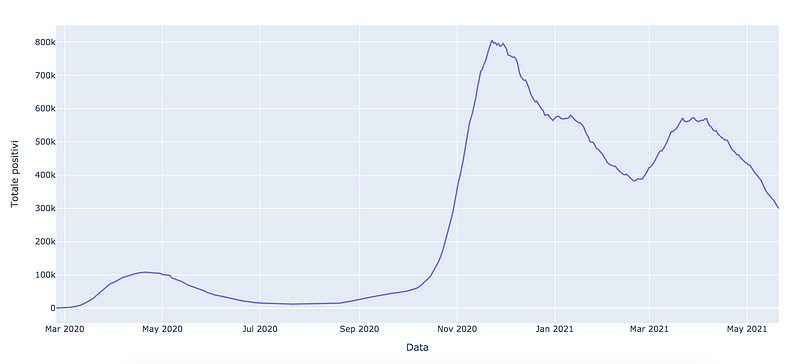
Now I can save the figure as an HTML file. I exploit the plotly.offline.plot() function. As a configuration parameter, I specify to not display the mode bar in the plot (config={‘displayModeBar’: False}). This is due to avoid to allow the user to manipulate the image in the HTML page.
plotly.offline.plot(fig,filename='positives.html',config={'displayModeBar': False})Now I can open the file positives.html and manipulate it. The file looks like the following piece of code:
<html>
  <head><meta charset="utf-8" /></head>
  <body>
    <div>
        <script type="text/javascript">window.PlotlyConfig =
             {MathJaxConfig: 'local'};
</script> <script type="text/javascript">
...
</script> <div id="9eec8ee0-8ebf-4199-8f61-7f86aab4cc81" class="plotly-graph-div" style="height:100%; width:100%;"></div> <script type="text/javascript">
...
</script> </div>
</body>
</html>The file is composed of 4 main parts. The second part is very long. The second and fourth parts can be copied to two different javascript files, without the opening and enclosing tags (<script type=”text/javascript”> and </script>)and named as chart-part1.js and chart-part2.js. Now I can replace the second and the fourth parts in the HTML file with the inclusion of the two javascript files:
<html>
<head><meta charset="utf-8" /></head>
<body>
<div>
<script type="text/javascript">window.PlotlyConfig = {MathJaxConfig: 'local'};</script>
<script src="js/chart-part1.js"></script>
<div id="9eec8ee0-8ebf-4199-8f61-7f86aab4cc81" class="plotly-graph-div" style="height:100%; width:100%;"></div>
<script src="js/chart-part2.js"></script>
    </div>
  </body>
</html>Note that I have saved the chart-part1.js and chart-part2.js files into the js folder. Now I can copy all the code included in the div wherever I want in my HTML Web Site, provided that I remind to also copy the js folder to my Web Site folder:
<div>
    <script type="text/javascript">window.PlotlyConfig = {MathJaxConfig: 'local'};</script>
    <script src="js/chart-part1.js"></script>

    <div id="9eec8ee0-8ebf-4199-8f61-7f86aab4cc81" class="plotly-graph-div" style="height:100%; width:100%;"></div>
    <script src="js/chart-part2.js"></script>
</div>
Altair
In this example I build a simple scatter plot using a default vega dataset, contained in the vega_datasetslibrary.
import altair as alt
from vega_datasets import data
chart = alt.Chart(data.cars.url).mark_point().encode(
x='Horsepower:Q',
y='Miles_per_Gallon:Q',
color='Origin:N'
)Now I can save the chart through the save() function:
chart.save('chart.html', embed_options={'actions': False})In the embed_options I specify that I don’t want to print the actions button. Alternatively, as proposed by @Alan Jones I can set staticPlot = True in my Plotly config rather than hiding the tool bar (which doesn’t actually stop the interaction). A static plot isn’t interactive and has no toolbar.
The produced HTML file looks like the following one:
<!DOCTYPE html>
<html>
<head>
  <style>
    .error {
        color: red;
    }
  </style>
  <script type="text/javascript" src="https://cdn.jsdelivr.net/npm//vega@5"></script>
  <script type="text/javascript" src="https://cdn.jsdelivr.net/npm//[email protected]"></script>
  <script type="text/javascript" src="https://cdn.jsdelivr.net/npm//vega-embed@6"></script>
</head>
<body>
  <div id="vis"></div>
  <script>
    (function(vegaEmbed) {
      var spec = {"config": {"view": {"continuousWidth": 400, "continuousHeight": 300}}, "data": {"url": "https://cdn.jsdelivr.net/npm/[email protected]/data/cars.json"}, "mark": "point", "encoding": {"color": {"type": "nominal", "field": "Origin"}, "x": {"type": "quantitative", "field": "Horsepower"}, "y": {"type": "quantitative", "field": "Miles_per_Gallon"}}, "$schema": "https://vega.github.io/schema/vega-lite/v4.8.1.json"};
      var embedOpt = {"actions": false, "mode": "vega-lite"};
function showError(el, error){
el.innerHTML = ('<div class="error" style="color:red;">'
+ '<p>JavaScript Error: ' + error.message + '</p>'
+ "<p>This usually means there's a typo in your chart specification. "
+ "See the javascript console for the full traceback.</p>"
+ '</div>');
throw error;
}
const el = document.getElementById('vis');
vegaEmbed("#vis", spec, embedOpt)
.catch(error => showError(el, error));
})(vegaEmbed);</script>
</body>
</html>I copy the code contained in the <script> tag into a javascript file, called chart.js. If I want to include the chart into a HTML Web page, I must put the following parts wherever I want in my HTML Web page:
<div id="vis"></div>
  <script src="js/chart.js"></script>
I should also remind to include the vega, vega-lite and vega-embed javascript files in the header of my HTML page. The final result looks like the following one:
<!DOCTYPE html>
<html>
<head>
  <style>
    .error {
        color: red;
    }
  </style>
  <script type="text/javascript" src="https://cdn.jsdelivr.net/npm//vega@5"></script>
  <script type="text/javascript" src="https://cdn.jsdelivr.net/npm//[email protected]"></script>
  <script type="text/javascript" src="https://cdn.jsdelivr.net/npm//vega-embed@6"></script>
</head>
<body>
  <div id="vis"></div>
  <script src="js/chart.js"></script>
</body>
</html>
Summary
In this short tutorial, I have illustrated how to include a Plot.ly or Altair Python graph into an HTML Web Site.
Three steps are required: generate the graph, save it as HTML and manipulate the output to make the code easy to include on another HTML page.
If you wanted to be updated on my research and other activities, you can follow me on Twitter, Youtube, and Github.


