How to Generate Synthetic Data for any Causal Inference Project in less than 10 Lines of Code
If 99% are Vaccinated, 1% Get a Reaction and 2% Get the Disease How Can You Generate Representative Synthetic Data?

Introduction
In “The Book of Why” Judea Pearl uses an example of vaccination, reaction, smallpox and fatalities to describe and explain “The Ladder of Causation” and this motivated me to implement the example in Python, but I could not find a way to generate the test data I needed to get started.
Before we dive into the synthetic data generation please consider …
Joining Medium with my referral link (I will receive a proportion of the fees if you sign up using this link).
Subscribing to a free e-mail whenever I publish a new story.
Taking a quick look at my previous articles.
Downloading my free strategic data-driven decision making framework.
Visiting my data science website — The Data Blog.
Background
Pearl proposes a causal diagram for the hypothetical relationships between a vaccination program, reactions (side-effects), development of the disease and fatalities arising from the disease and side-effects as follows …
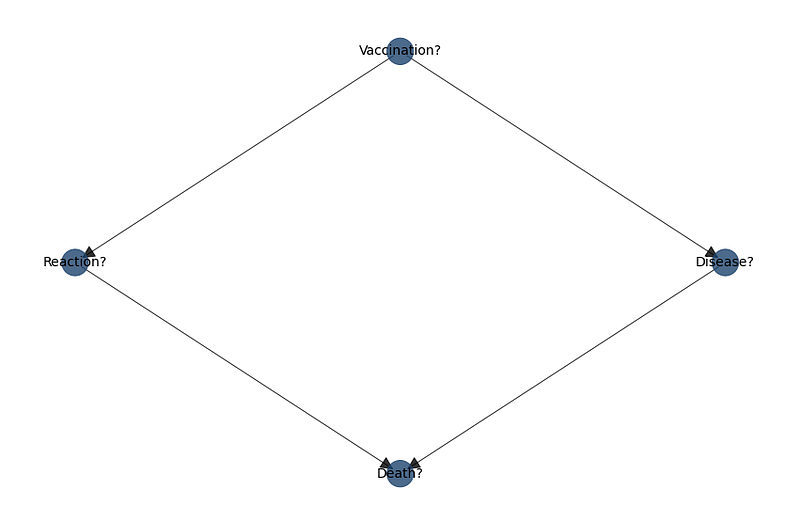
Pearl then goes on to describe the findings of a hypothetical survey as follows …
- Out of 1 million children, 990,000 (99%) are vaccinated
- Of those vaccinated, 9,900 (1% of 990,000) have a reaction
- Of those that have a reaction, 99 (1% of 9,900) die from the reaction
- Of those not vaccinated, 200 (2% of 10,000) get smallpox
- Of those that get smallpox, 40 (20% of 200) die from the disease
Given the causal influence diagram proposed by Pearl and the statistics from the hypothetical survey I surmised that my first step was to create a dataset to represent the survey as a pandas DataFrame so I looked around on the Internet for a way to create the data.
I found scikit-learn libraries for generating “blob” and “classification” data and I also found libraries like faker and SDV but I could not find anything to generate a binary dataset suitable as an input for a causal or probabilistic model.
Given that I could not find anything suitable online and that I needed some data to begin my causal inference journey, I set about writing code that can create any synthetic binary dataset myself …
A Procedural Solution
The basic requirements are -
- Create a blank
DataFramewith the correct number of rows and features - Update the
DataFramewith values that represent each one of the 5 findings from the hypothetical survey
Creating the empty DataFrame is very straight-forward -
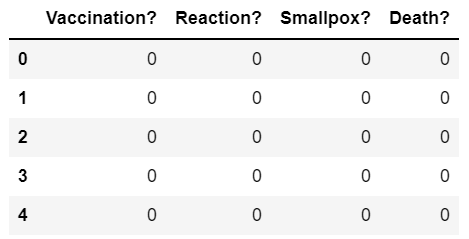
The next step is to implement this rule — “Out of 1 million children, 990,000 (99%) are vaccinated” by changing Vaccination? = 0 to Vaccination? = 1 for 990,000 or 99% of the rows.
That turned out to be surprisingly difficult. My first thought was to take a sample using DataFrame.sample(990000) and to update the values but the update is not applied to the underlying DataFrame so that does not work.
After some experimentation, this is the solution I came up with …
… and to make sure the code worked …
1    990000
0     10000
Name: Vaccination?, dtype: int64
So far, so good. The next stage is to implement this rule — “Of those vaccinated, 9,900 (1% of 990,000) have a reaction”. This is a bit more complicated as it requires 2 stages -
- Select the rows where
Vaccination? == 1 - Set
Reaction? = 1for 9,900 (or 1%) of those selected rows
After a bit more trial-and-error, this is the solution I developed …
… and to test it out …
Vaccination? Reaction? Smallpox? Death?
1 0 0 0 980100
0 0 0 0 10000
1 1 0 0 9900
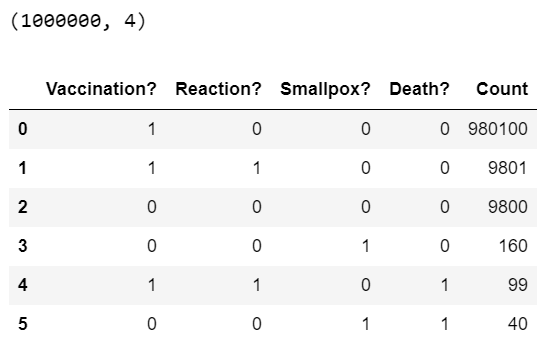
dtype: int64Now that the hard work of finding a solution is over, the entire dataset that implements all 5 rules can be generated in just a few lines of code …
… and to verify the solution …
An Object Oriented Programming (OOP) Solution
The procedural solution provides a decent implementation for generating synthetic binary datasets to be used as the inputs to causal and probabilistic projects but it can be re-written as an OOP solution to reduce code duplication and to maximize code re-use …
Creating our synthetic dataset for the hypothetical smallpox example then becomes very straight-forward …
If you would like to download the full version of the binary data generator including comprehensive documentation, please head over to this gist in GitHub.
Conclusion
Causal inference is a hot-topic and the number of libraries and articles supporting and informing this branch of machine learning and artificial intelligence are increasing exponentially.
However the first step to creating a project to test a causal inference solution is to create some synthetic data and there are no libraries or articles that provide a template for the data creation.
This article has explored the background to the problem, provided a procedural solution to generate the synthetic data and also provided an object-oriented solution that can be easily re-used to generate synthetic data to test any causal inference problem.
If you enjoyed this article please consider …
Joining Medium with my referral link (I will receive a proportion of the fees if you sign up using this link).
Subscribing to a free e-mail whenever I publish a new story.
Taking a quick look at my previous articles.
Downloading my free strategic data-driven decision making framework.
Visiting my data science website — The Data Blog.


