How to Generate Strong Trading Signals Using a Simple Trick
Using the Moving Average Testing Ground Technique

Moving averages can also have many trading techniques applied on them in order to generate directional signals. This article discusses a technique called the testing ground which relies on a successive test of the moving average line.
Introduction to Moving Averages
Moving averages are a commonly used statistical tool in finance, economics, and data analysis. They are used to analyze time series data and identify trends or patterns over a specific period of time.
A moving average calculates the average value of a data series over a defined number of previous periods. As new data points become available, the oldest data point is dropped, and the newest one is included in the calculation. This creates a “moving” average that adjusts over time.
Moving averages smooth out short-term fluctuations and noise in data, providing a clearer picture of the underlying trend. They are particularly useful for identifying the direction of a trend, determining support and resistance levels, and generating trading signals in financial markets.
There are different types of moving averages, including simple moving averages (SMA) and exponential moving averages (EMA). A simple moving average calculates the average of the data points over a specified period equally weighted, while an exponential moving average assigns greater weight to recent data points, making it more responsive to recent price changes.
Moving averages can be applied to various types of data, such as stock prices, exchange rates, sales figures, or any other time-dependent series. They are often plotted as lines on charts, allowing analysts and traders to visually interpret the data and make informed decisions based on the observed trends.
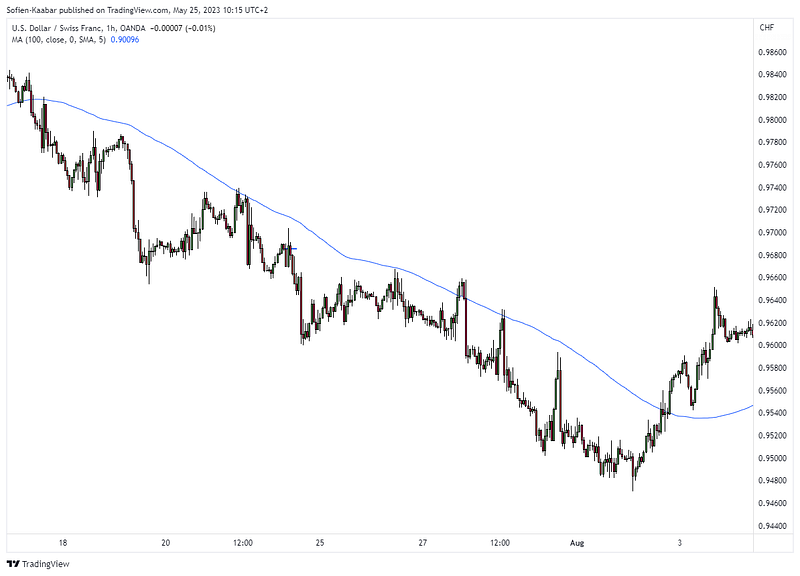
The following Figure shows an example of a 100-period moving average applied on USDCHF.
Contrarian trading is a form of art that requires specialized tools. Learn how to improve your contrarian trading using Python in my book!
The Moving Average Testing Ground Technique
This technique is very simple and relies on the concept of testing a level to generate its signals. The trading conditions are as follows:
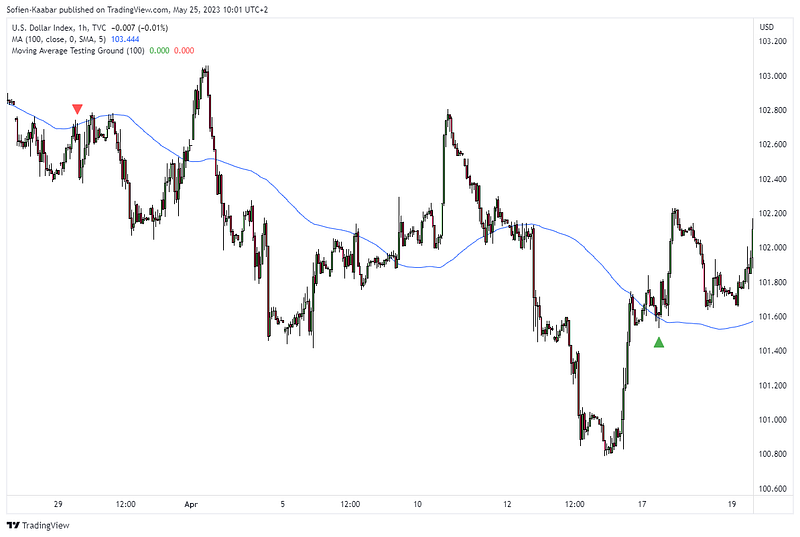
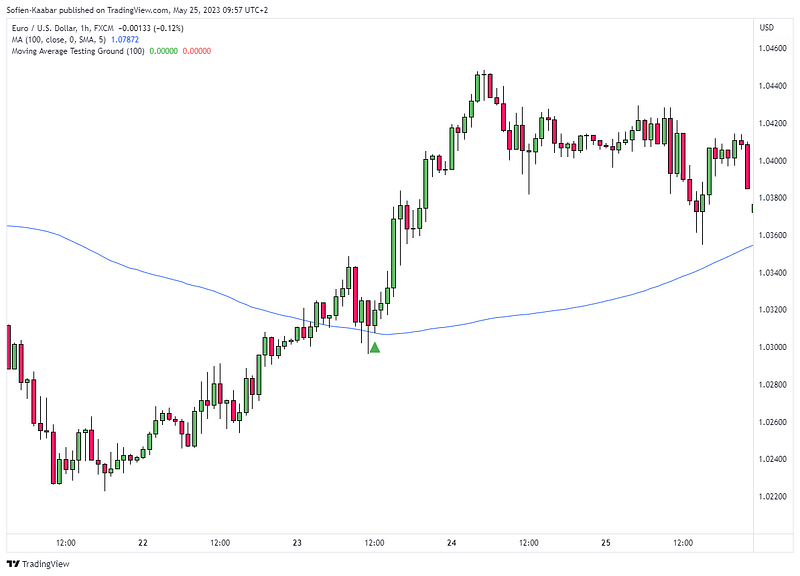
- A bullish signal is generated whenever the market shapes three successive lows below the moving average line but every time, it closes above the moving average line.
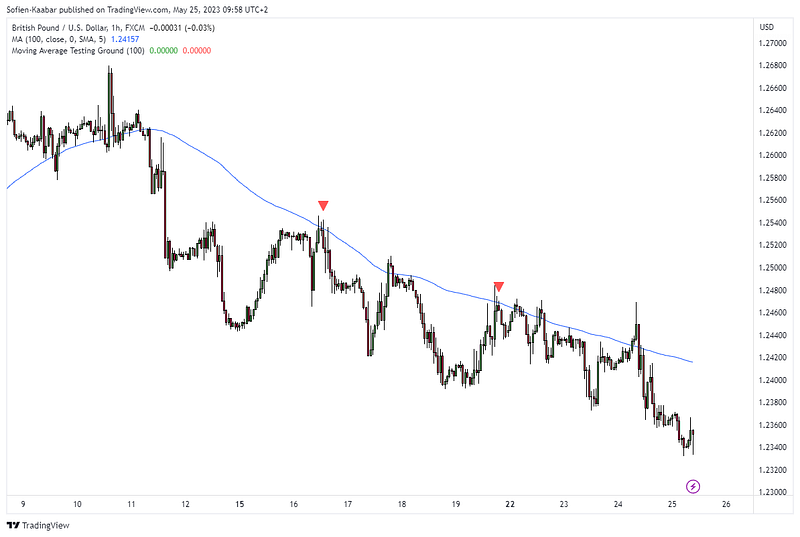
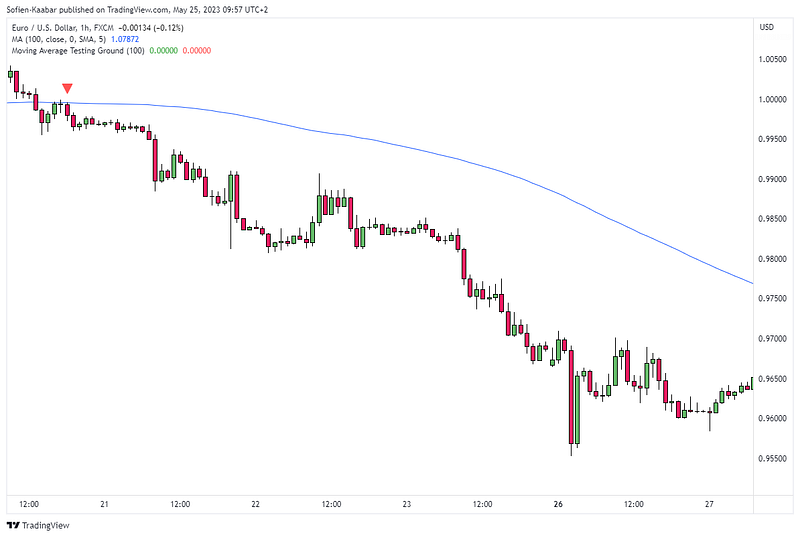
- A bearish signal is generated whenever the market shapes three successive highs above the moving average line but every time, it closes below the moving average line.
It is worth noting that the technique may suffer from a few false signals and the best way to use it is to try a few lookback periods on the moving average so that you have an aggregate score. By default, 100 seems to be decent enough across lookback periods, but that may not hold for every market.
The following Figure shows a bullish signal:
The following Figure shows a bearish signal:
The code for the technique is as follows:
// This source code is subject to the terms of the Mozilla Public License 2.0 at https://mozilla.org/MPL/2.0/
// © Sofien-Kaabar

//@version=5
indicator("Moving Average Testing Ground", overlay = true)
lookback = input(defval = 100, title = 'Lookback')
ma = ta.sma(close, lookback)
buy  = low < ma and low[1] < ma[1] and low[2] < ma[2] and math.min(close, open) > ma and math.min(close[1], open[1]) > ma[1] and math.min(close[2], open[2]) > ma[2]
sell = high > ma and high[1] > ma[1] and high[2] > ma[2] and math.max(close, open) < ma and math.max(close[1], open[1]) < ma[1] and math.max(close[2], open[2]) < ma[2]
plotshape(buy,  style = shape.triangleup,   color = color.green,  location =  location.belowbar, size = size.small)
plotshape(sell,  style = shape.triangledown, color = color.red,    location =  location.abovebar, size = size.small)