How to generate AI Alpha Factor in Python
Machine Learning to combine multiple alpha factors for quant trading

I described basics of alpha research in my previous post — How to Build Quant Algorithmic Trading Model in Python and backtesting process in How to Perform Backtesting in Python. Here’s how to apply machine learning technique in generating a better alpha from a number of alpha factors. There are many different ways to achieve this and what I applied here is a classification by supervised machine learning, taking a quantised one-week forward return as the label and calculate the weighted sum of probability of each label.
Features
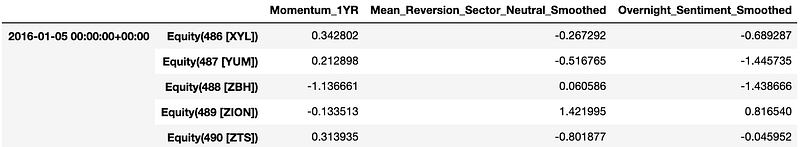
In Section 3 of the previous post, I used the following three factors (zscore of the rank) and simply took the average to calculate the final alpha signal.
- Momentum 1 Year Factor
- Mean Reversion 5 Day Sector Neutral Smoothed Factor
- Overnight Sentiment Smoothed Factor
Now, taking these as a part of features for machine learning, let’s consider some more features.
Universal Quant Features
Add some features to capture the universe of stocks:
- Annualized Volatility over 20 days, 120days
- Average Dollar Volume over 20days, 120days
- Sector

Regime Features
Add some features to capture the market-wide regimes:
- High and low Volatility over 20 days, 120days
- High and low Dispersion 20days, 120days

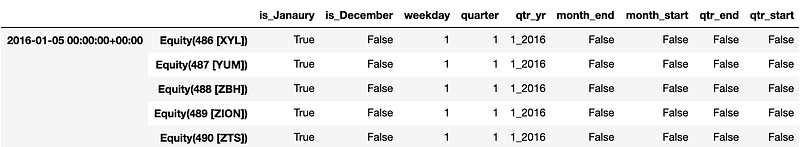
Date Features
Make columns for the trees to split on that might capture trader/investor behavior due to calendar anomalies.
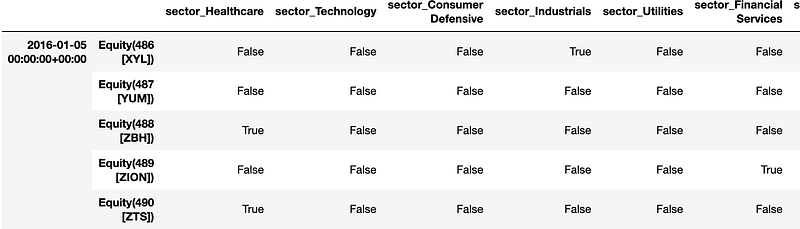
One Hot Encoding
The sector value is 0 to 10, which are just labels and the number itself does not hold meaning. If we use this as a feature, the model will consider the value as numerical input — e.g. 3 is larger than 2 and smaller than 5, 1+6=7, which is not true. In this case, we can apply one hot encoding. pandas DataFrame function get_dummies or OneHotEncoder from sklearn preprocessing are useful, which basically do this:
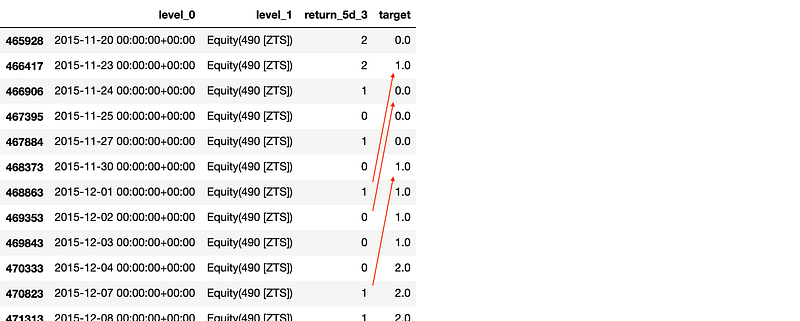
Target
Let the model predict the forward 1-week return based on the above features. Although his can be solved by either regression or classification, fitting a model to the exact return value sounds a bit too much. Thus, take a quantised return and fit a classifier to each bucket, then apply some weight to each bucket to synthesise the alpha factor.
Model and Train
Now the features and the target is ready, a normal machine learning model can be applied.
Split the data
Data should not be shuffled the train, validation and test sets should be taken from the oldest to newer as we have to use past data for future prediction. The following piece of code does this split into 60% train, 20% validation and 20% test set in the same way as train_test_split() from sklearn.
Training
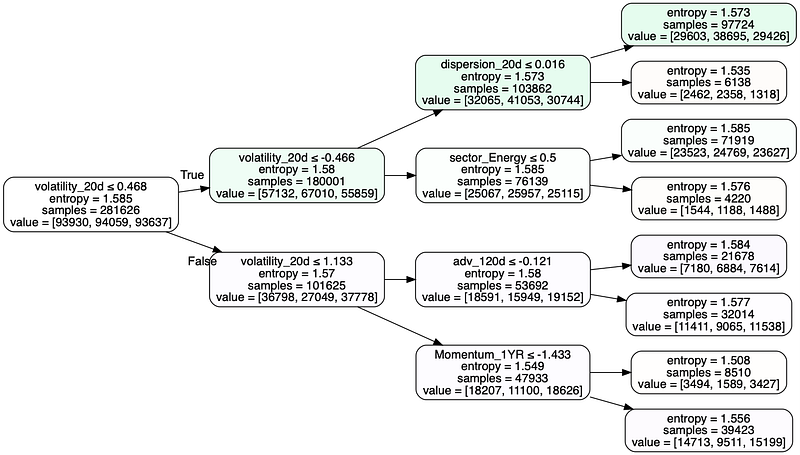
Use a tree based classifier such as Random Forest as it has better explainability. Tune the parameter based on the validation score with minimum sample leaf ≥ the number of stocks in the universe.
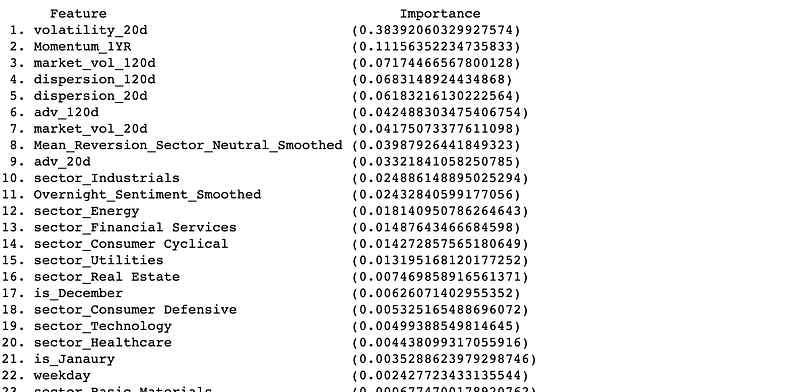
Although the accuracy is relatively low, still better than taking the average by equal or random weight. You can visualise the decision tree and feature importance to understand the logic behind the model:
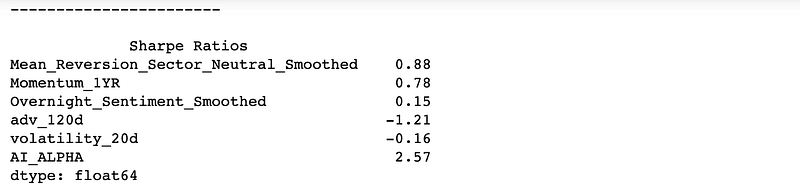
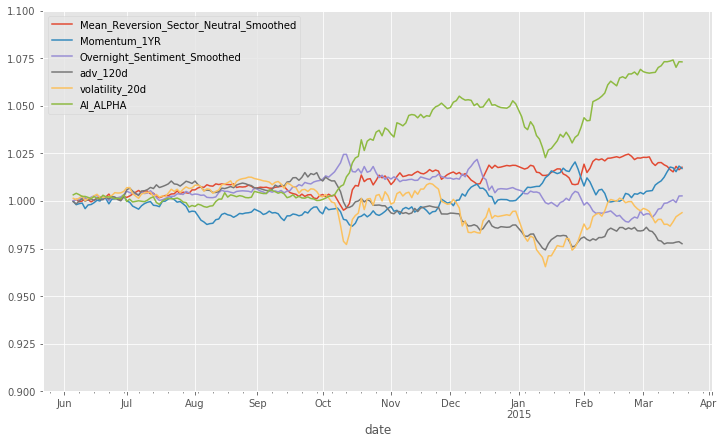
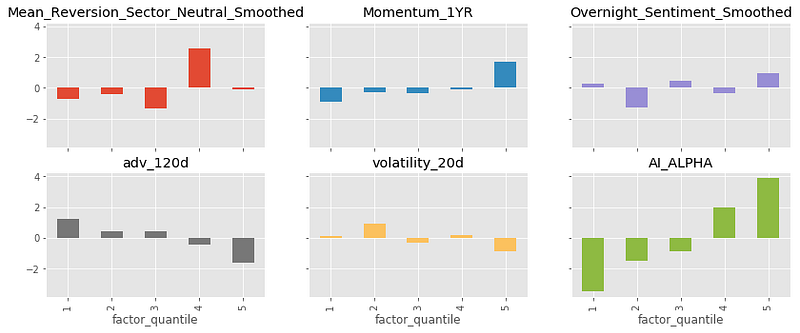
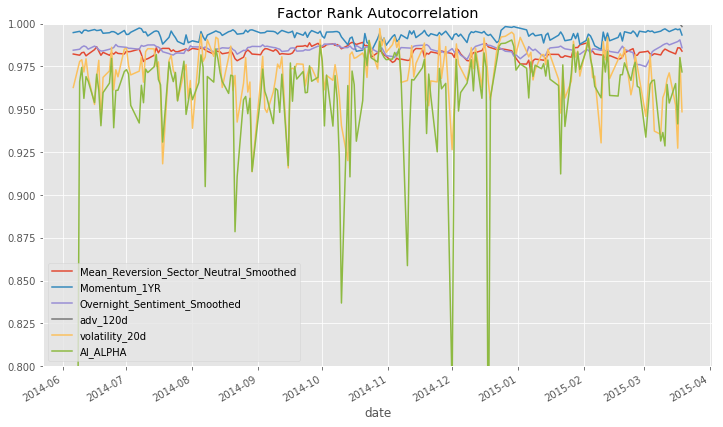
Once the prediction is made on the quantised label, apply a weight to generate a synthesised alpha vector on which the performance is measured.
The performance is measured by alphalens in the same way as explained in the previous post.
Ensemble of non-overlapping trees
Overlapping samples tend to result in overfitting and not performing well in production. Use the non-IID (i.e. Independent and Identically Distributed) labels to mitigate likely overfitting.
Test
Finally, once all the parameter has been fixed, test the performance on unseen test set. As is always the case for any machine learning, parameters should not be changed based on the performance of this test to avoid the leakage.
First, roll forward the training to “current day” in production, so re-train the model on train & validation dataset. Then, the use X_test to see the performance on test set.
Conclusion
This post sees a basic way to use machine learning to generate an alpha vector from the number of factors. The model is too simple and does not perform well but has a number of aspects to consider when building such a model in real situation. The improvements include but not limited to; more complex classifiers, different range and quantiles for the target, more features and more input data. Also, backtesting should be performed to validate the alpha including transaction cost and various constraints, which I will make another post later. If you are interested in end-to-end alpha research process, see my previous post:
Thank you for reading!


