How to Follow the Trend With the Double Confirmation Trading Strategy.
How to Code a Trend-Following Strategy With the RSI & Parabolic SAR.

In a previous article, the Parabolic-RSI strategy has been presented. This article deals with another strategy that uses both indicators, forming a type of diversification between strategies.
I have just published a new book after the success of my previous one “New Technical Indicators in Python”. It features a more complete description and addition of structured trading strategies with a GitHub page dedicated to the continuously updated code. If you feel that this interests you, feel free to visit the below Amazon link, or if you prefer to buy the PDF version, you could contact me on LinkedIn.
The Parabolic Stop-And-Reverse Indicator
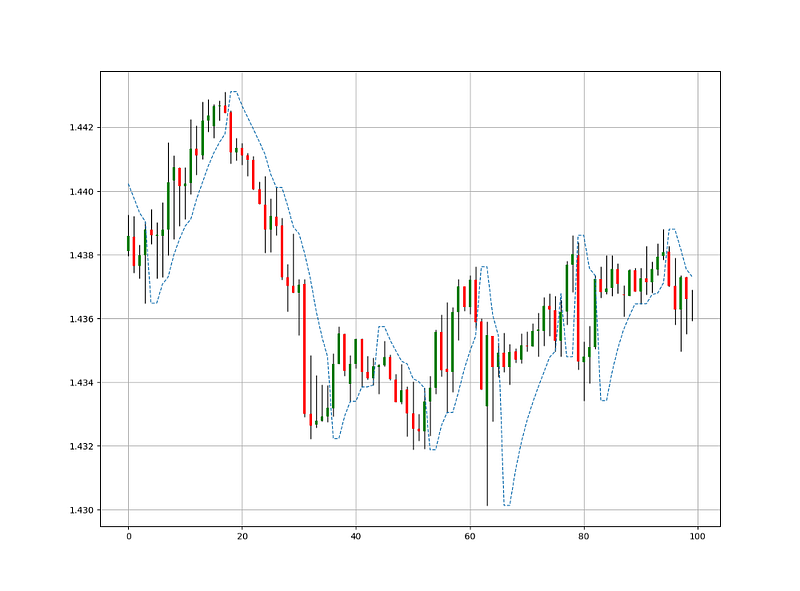
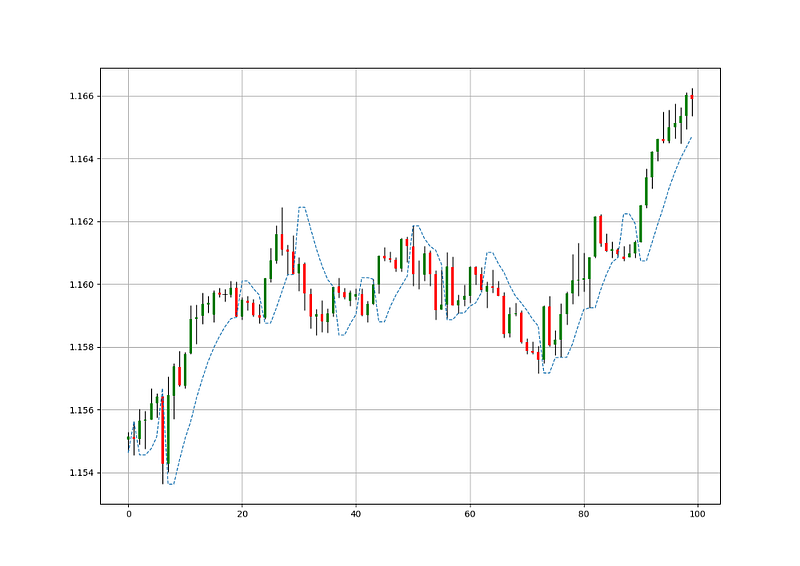
The Parabolic Stop-And-Reverse is an interesting trend-following indicator created by Wilder Willes who is also the creator of the famous RSI. This indicator is mostly used as a trailing stop that tracks the trend as it develops but there is no harm in testing it as a trading strategy. It is worth noting that it performs relatively well in steady trends but just as any other indicator, it has its weakness, in this case, ranging markets.
I will refer to a python library called talib from where the user could import the sar function that uses a data frame and calculates the values. Having modified that function, you can refer to the one below (I do not take credit for it as I merely just changed some lines as opposed to the other functions which have been coded by me):
def sar(s, af = 0.02, amax = 0.2):

    high, low = s.high, s.low
# Starting values
sig0, xpt0, af0 = True, high[0], af
sar = [low[0] - (high - low).std()] for i in range(1, len(s)):
sig1, xpt1, af1 = sig0, xpt0, af0 lmin = min(low[i - 1], low[i])
lmax = max(high[i - 1], high[i]) if sig1:
sig0 = low[i] > sar[-1]
xpt0 = max(lmax, xpt1)
else:
sig0 = high[i] >= sar[-1]
xpt0 = min(lmin, xpt1) if sig0 == sig1:
sari = sar[-1] + (xpt1 - sar[-1])*af1
af0 = min(amax, af1 + af) if sig0:
af0 = af0 if xpt0 > xpt1 else af1
sari = min(sari, lmin)
else:
af0 = af0 if xpt0 < xpt1 else af1
sari = max(sari, lmax)
else:
af0 = af
sari = xpt0 sar.append(sari) return sarThe basic understanding is that when the Parabolic SAR (the black dots around the market price) is under the current price, then the outlook is bullish and when it is above the current price, then the outlook is bearish.
To add the Parabolic SAR to your OHLC array, use the following steps:
# If you have an array
my_data = pd.DataFrame(my_data)
# Renaming the columns to fit the function
my_data.columns = ['open','high','low','close']# Calculating the Parabolic SAR
Parabolic = sar(my_data, 0.01, 0.2)# Converting the Parabolic values back to an array
Parabolic = np.array(Parabolic)# Reshaping
Parabolic = np.reshape(Parabolic, (-1, 1))# Concatenating with the OHLC Data
my_data = np.concatenate((my_data, Parabolic), axis = 1)If you want to support me and the articles I regularly publish, please consider subscribing to my DAILY Newsletter (A Free Plan is Available) via the below link. It features my Medium articles, more trading strategies, coding lessons related to research and analysis and subscribers get a free PDF copy of my book. You can expect 5–7 articles per week with your subscription. This would help me continue sharing my research. Thank you!
The Relative Strength Index
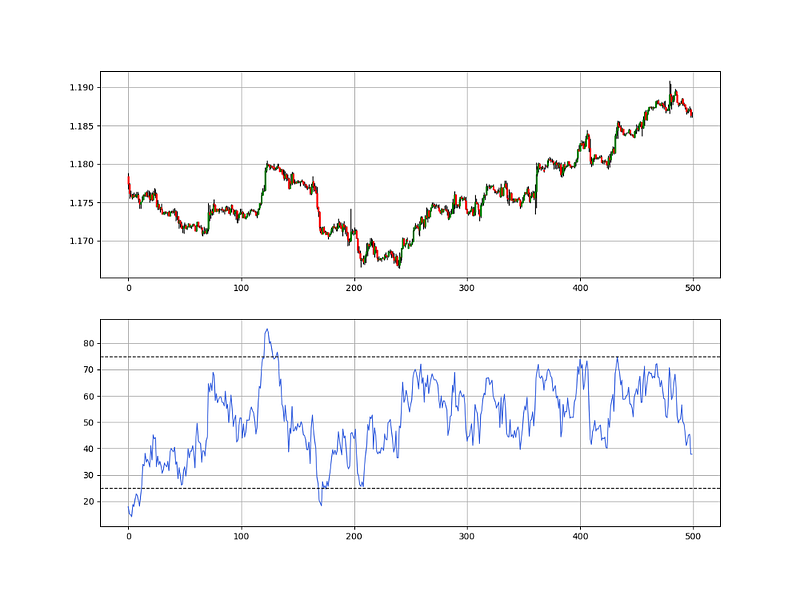
The RSI is without a doubt the most famous momentum indicator out there, and this is to be expected as it has many strengths especially in ranging markets. It is also bounded between 0 and 100 which makes it easier to interpret.
Also, the fact that it is famous, contributes to its potential. This is because the more traders and portfolio managers look at the RSI, the more people will react based on its signals and this in turn can push market prices. Of course, we cannot prove this idea, but it is intuitive as one of the basis of Technical Analysis is that it is self-fulfilling.
The RSI is calculated using a rather simple way. We first start by taking price differences of one period. This means that we have to subtract every closing price from the one before it. Then, we will calculate the smoothed average of the positive differences and divide it by the smoothed average of the negative differences. The last calculation gives us the Relative Strength which is then used in the RSI formula to be transformed into a measure between 0 and 100.
To calculate the Relative Strength Index, we need an OHLC array (not a data frame). This means that we will be looking at an array of 4 columns. The function for the Relative Strength Index is therefore:
# The function to add a number of columns inside an array
def adder(Data, times):

    for i in range(1, times + 1):

        new_col = np.zeros((len(Data), 1), dtype = float)
        Data = np.append(Data, new_col, axis = 1)

    return Data
# The function to delete a number of columns starting from an index
def deleter(Data, index, times):
for i in range(1, times + 1):
Data = np.delete(Data, index, axis = 1)
return Data
# The function to delete a number of rows from the beginning
def jump(Data, jump):
Data = Data[jump:, ]
return Data# Example of adding 3 empty columns to an array
my_ohlc_array = adder(my_ohlc_array, 3)# Example of deleting the 2 columns after the column indexed at 3
my_ohlc_array = deleter(my_ohlc_array, 3, 2)# Example of deleting the first 20 rows
my_ohlc_array = jump(my_ohlc_array, 20)# Remember, OHLC is an abbreviation of Open, High, Low, and Close and it refers to the standard historical data filedef ma(Data, lookback, close, where):
Data = adder(Data, 1)
for i in range(len(Data)):
try:
Data[i, where] = (Data[i - lookback + 1:i + 1, close].mean())
except IndexError:
pass
# Cleaning
Data = jump(Data, lookback)
return Datadef ema(Data, alpha, lookback, what, where):
alpha = alpha / (lookback + 1.0)
beta = 1 - alpha
# First value is a simple SMA
Data = ma(Data, lookback, what, where)
# Calculating first EMA
Data[lookback + 1, where] = (Data[lookback + 1, what] * alpha) + (Data[lookback, where] * beta)
# Calculating the rest of EMA
for i in range(lookback + 2, len(Data)):
try:
Data[i, where] = (Data[i, what] * alpha) + (Data[i - 1, where] * beta)
except IndexError:
pass
return Datadef rsi(Data, lookback, close, where, width = 1, genre = 'Smoothed'):
# Adding a few columns
Data = adder(Data, 7)
# Calculating Differences
for i in range(len(Data)):
Data[i, where] = Data[i, close] - Data[i - width, close]
# Calculating the Up and Down absolute values
for i in range(len(Data)):
if Data[i, where] > 0:
Data[i, where + 1] = Data[i, where]
elif Data[i, where] < 0:
Data[i, where + 2] = abs(Data[i, where])
# Calculating the Smoothed Moving Average on Up and Down
absolute values
if genre == 'Smoothed':
lookback = (lookback * 2) - 1 # From exponential to smoothed
Data = ema(Data, 2, lookback, where + 1, where + 3)
Data = ema(Data, 2, lookback, where + 2, where + 4)
if genre == 'Simple':
Data = ma(Data, lookback, where + 1, where + 3)
Data = ma(Data, lookback, where + 2, where + 4)
# Calculating the Relative Strength
Data[:, where + 5] = Data[:, where + 3] / Data[:, where + 4]
# Calculate the Relative Strength Index
Data[:, where + 6] = (100 - (100 / (1 + Data[:, where + 5])))
# Cleaning
Data = deleter(Data, where, 6)
Data = jump(Data, lookback) return Data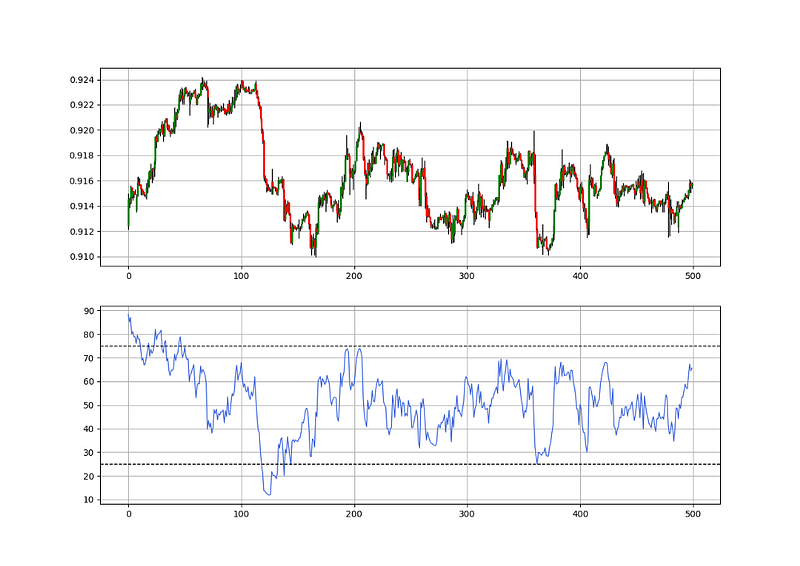
If you are also interested by more technical indicators and using Python to create strategies, then my best-selling book on Technical Indicators may interest you:
Creating the Strategy
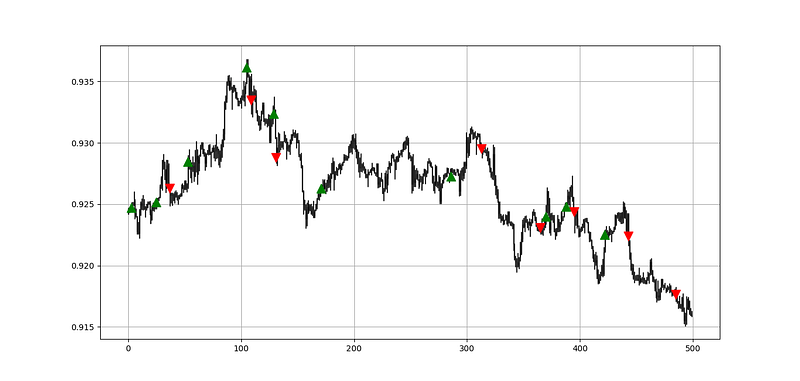
The strategy is based on the Parabolic flip while the RSI is satisfying a certain condition, acting as a trend filter. The following are the trading rules:
- A buy (Long) signal is generated whenever the market price surpasses the Parabolic SAR while the 13-period RSI is above 50.
- A sell (Short) signal is generated whenever the market price breaks the Parabolic SAR while the 13-period RSI is below 50.
def signal(Data, close, psar_col, rsi_col, buy, sell):

    Data = adder(Data, 10)

    for i in range(len(Data)):

        if Data[i, close] > Data[i, psar_col] and Data[i - 1, close] < Data[i - 1, psar_col] and Data[i, rsi_col] > 50:

            Data[i, buy] = 1

        elif Data[i, close] < Data[i, psar_col] and Data[i - 1, close] > Data[i - 1, psar_col] and Data[i, rsi_col] < 50:

            Data[i, sell] = -1

    return Data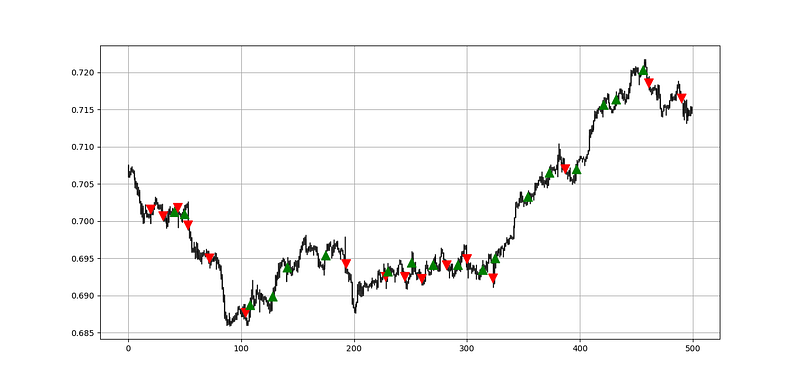
The strategy may need tweaking as the default parameters are noisy. We can consider increasing the lookback period on the RSI to decrease the frequency of signals and to provide better confirmation. Overall, the strategy seems to capture some good trends from time to time but suffers from a sizeable number of false signals.
Conclusion
Remember to always do your back-tests. You should always believe that other people are wrong. My indicators and style of trading may work for me but maybe not for you.
I am a firm believer of not spoon-feeding. I have learnt by doing and not by copying. You should get the idea, the function, the intuition, the conditions of the strategy, and then elaborate (an even better) one yourself so that you back-test and improve it before deciding to take it live or to eliminate it. My choice of not providing specific Back-testing results should lead the reader to explore more herself the strategy and work on it more.
Medium is a hub to many interesting reads. I read a lot of articles before I decided to start writing. Consider joining Medium using my referral link!
To sum up, are the strategies I provide realistic? Yes, but only by optimizing the environment (robust algorithm, low costs, honest broker, proper risk management, and order management). Are the strategies provided only for the sole use of trading? No, it is to stimulate brainstorming and getting more trading ideas as we are all sick of hearing about an oversold RSI as a reason to go short or a resistance being surpassed as a reason to go long. I am trying to introduce a new field called Objective Technical Analysis where we use hard data to judge our techniques rather than rely on outdated classical methods.
One Last Word
I have recently started an NFT collection that aims to support different humanitarian and medical causes. The Society of Light is a set of limited collectibles which will help make the world slightly better as each sale will see a percentage of it sent directly to the charity attributed to the avatar. As I always say, nothing better than a bullet list to outline the benefits of buying these NFT’s:
- High-potential gain: By concentrating the remaining sales proceedings on marketing and promoting The Society of Light, I am aiming to maximize their value as much as possible in the secondary market. Remember that trading in the secondary market also means that a portion of royalties will be donated to the same charity.
- Art collection and portfolio diversification: Having a collection of avatars that symbolize good deeds is truly satisfying. Investing does not need to only have selfish needs even though there is nothing wrong with investing to make money. But what about investing to make money, help others, and collect art?
- Donating to your preferred cause(s): This is a flexible way of allocating different funds to your charities.
- A free copy of my book in PDF: Any buyer of any NFT will receive a free copy of my latest book shown in the link of the article.